Chapter 11 - Core Concepts
Prelims Syllabus
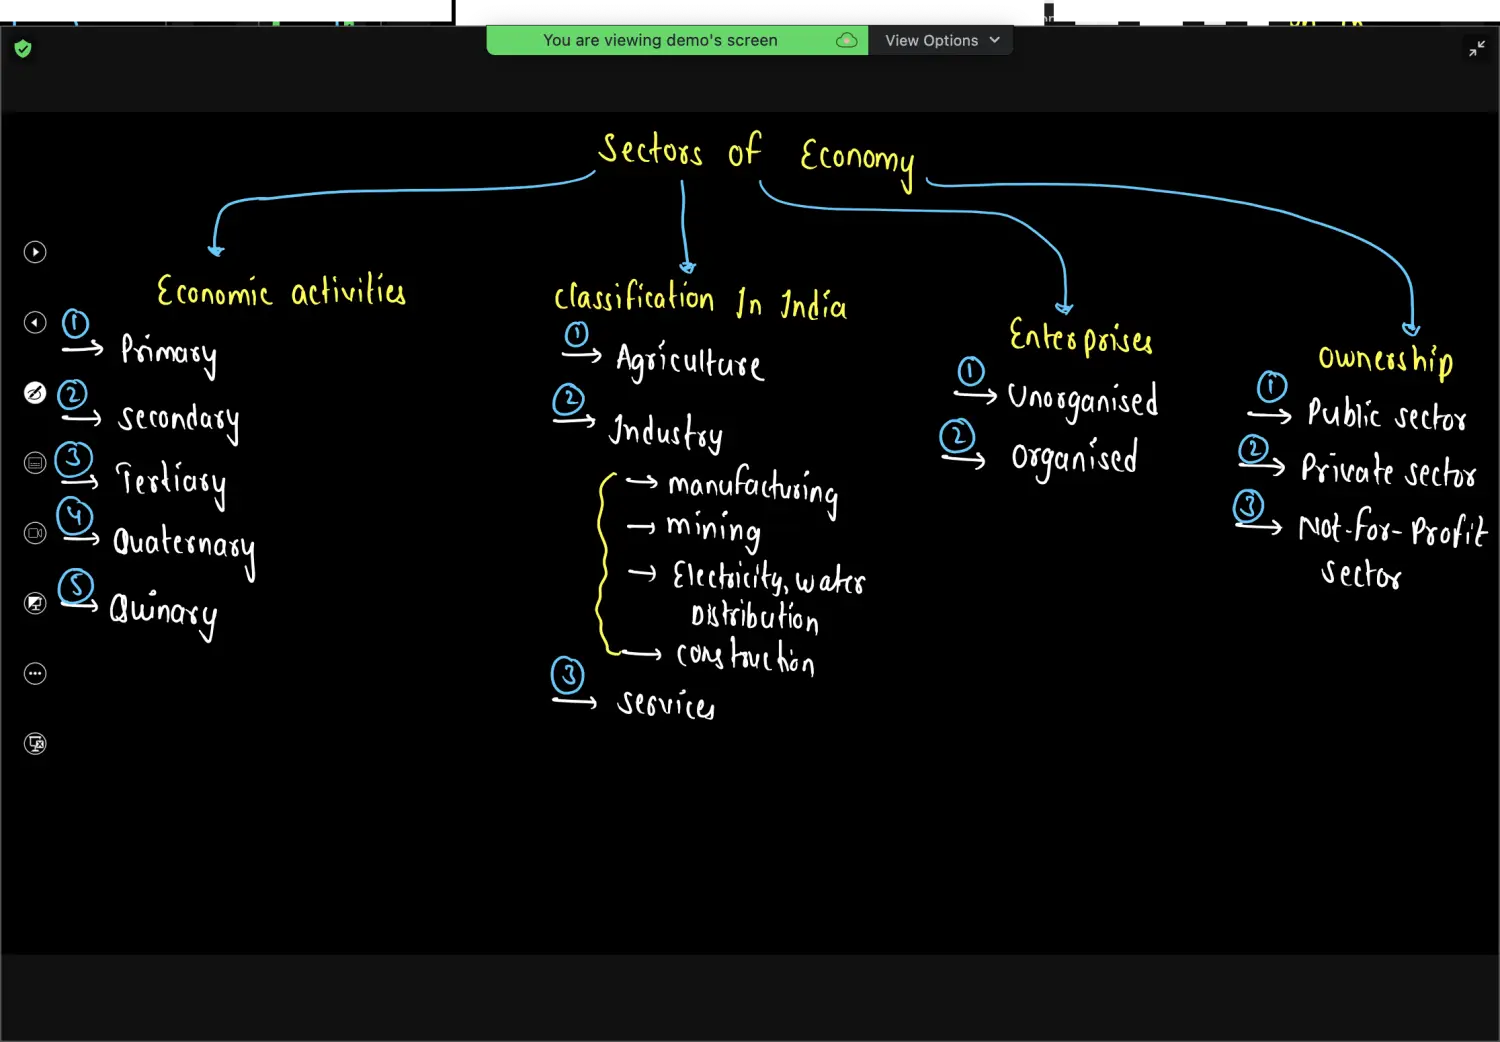
Sectors of Economy
Introduction to the Chapter
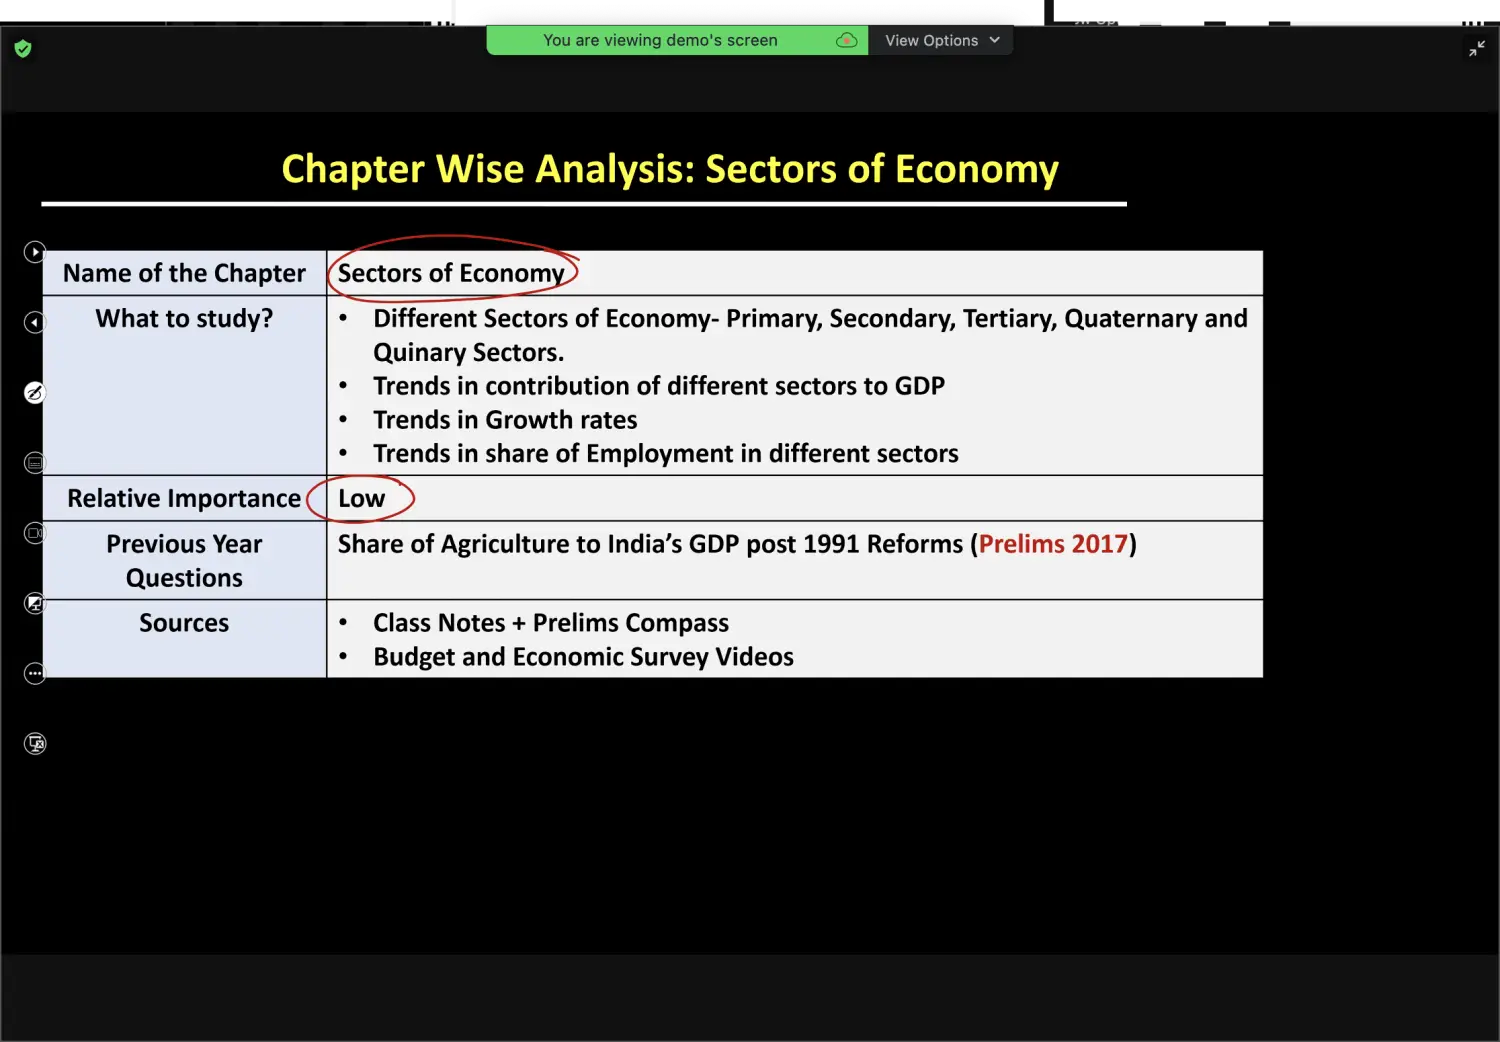
Low Importance - in Last 5 to 6 Years Prelims Only One questions has been asked from this Chapter
PYQP - wrt Trends
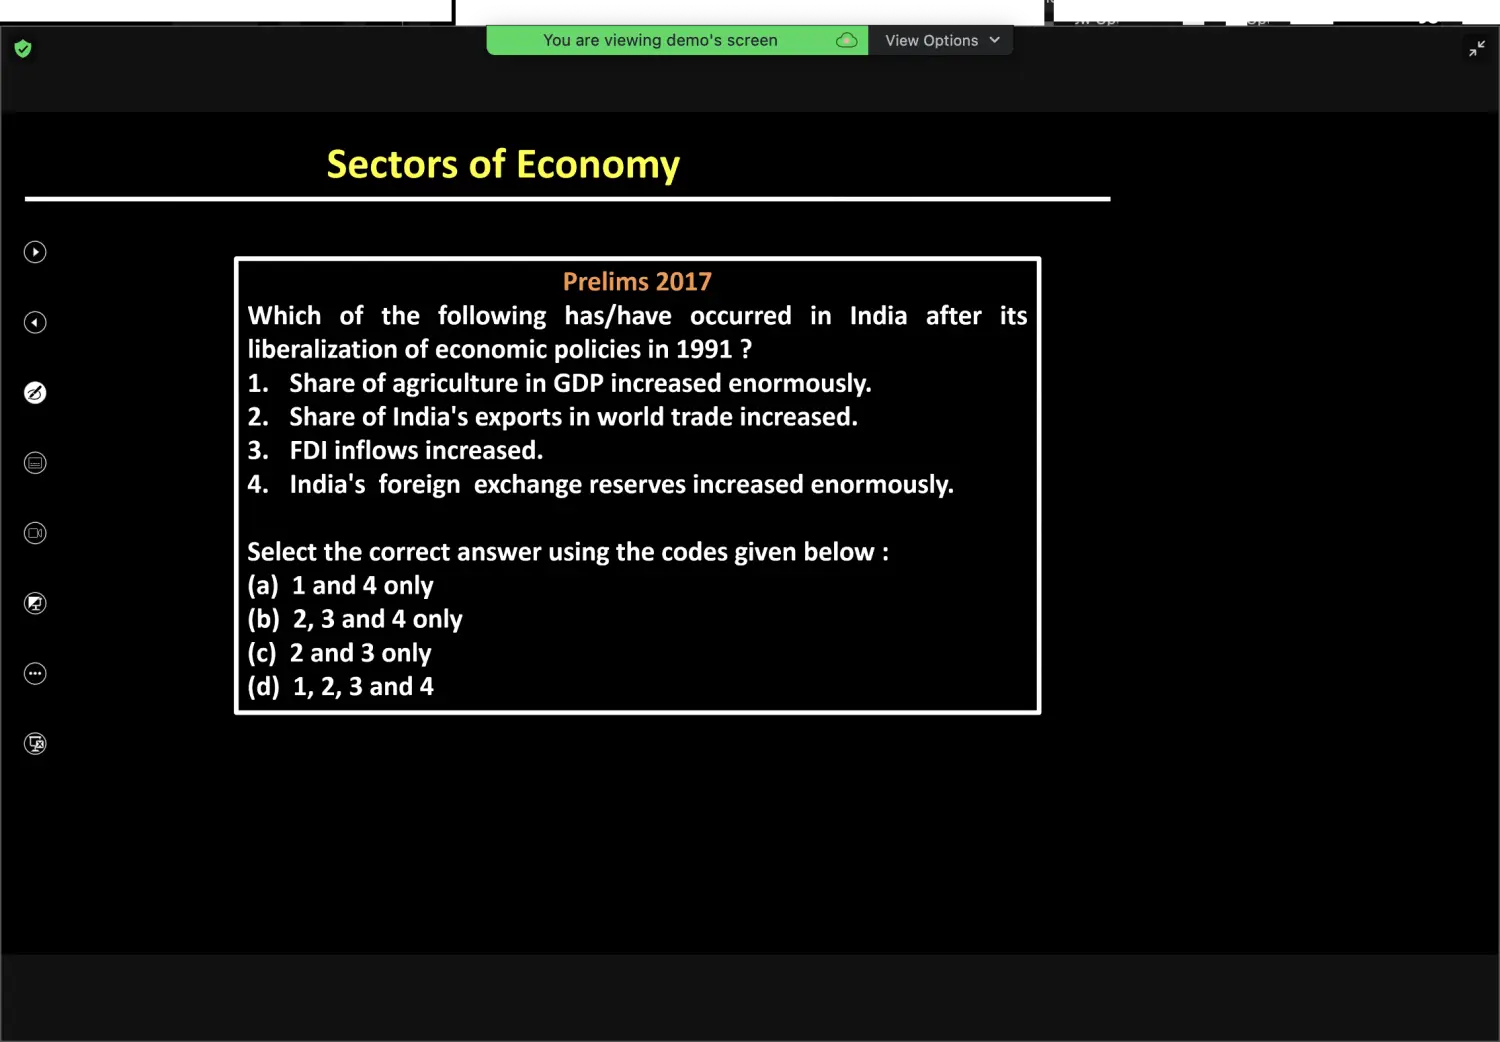
Inference
- General Trend is asked
- Not on Facts and Figures
- Don’t have to remember all the Trends, Only Some Specific Ones
Categorisation based on Economic Activities
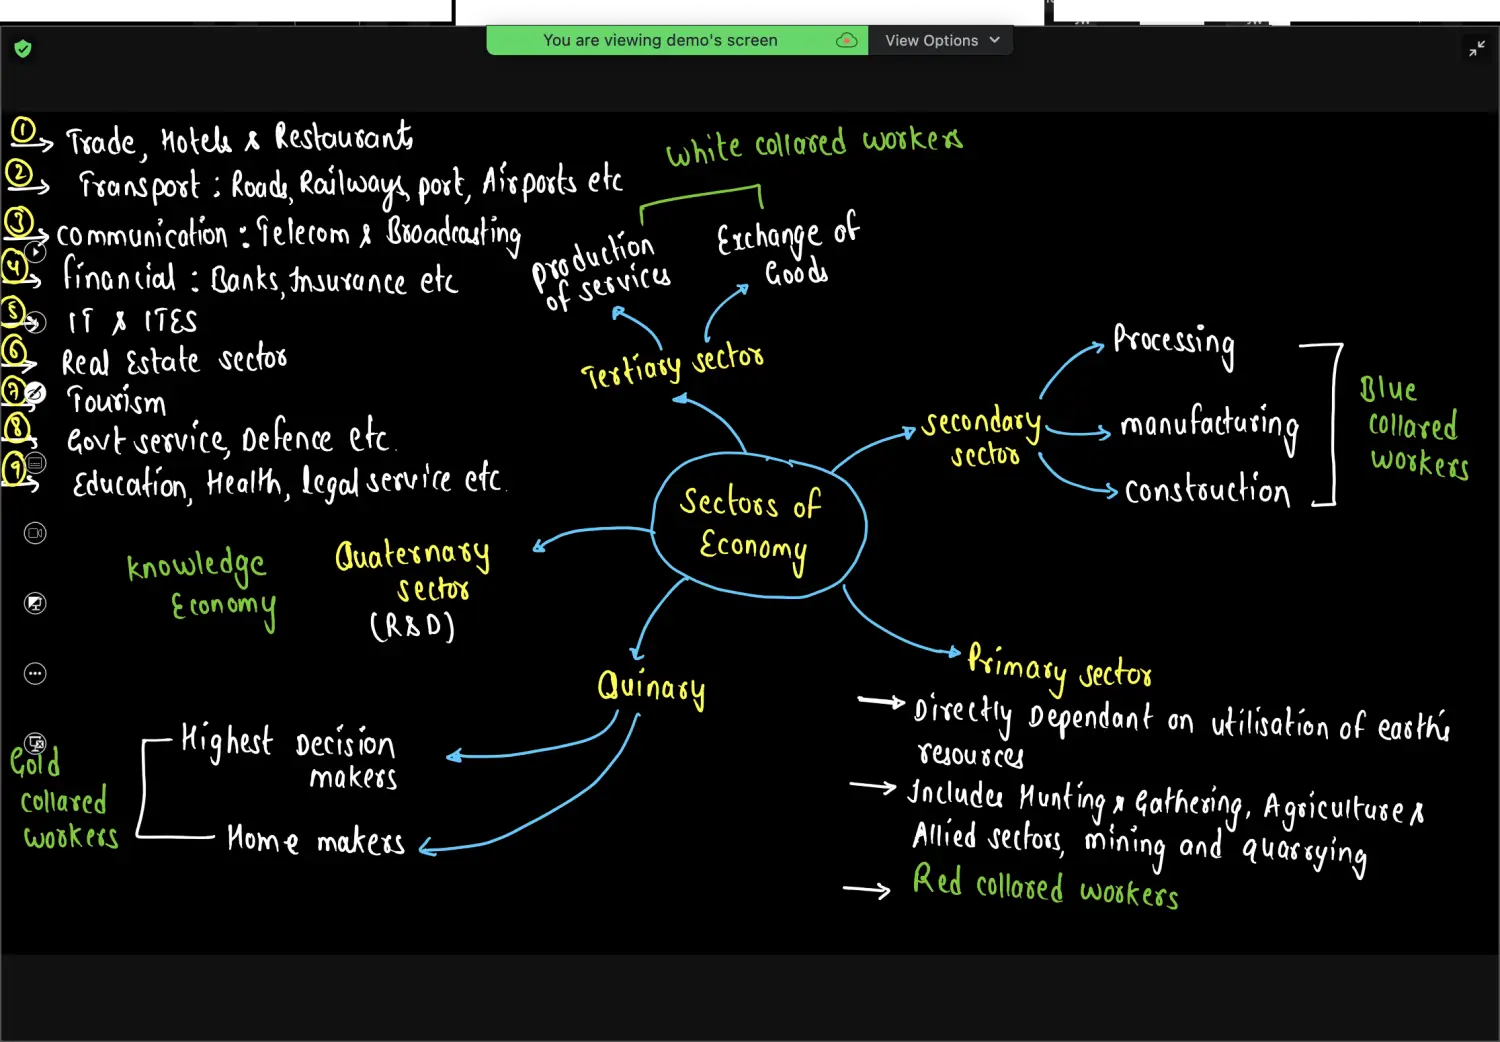
Primary Sector
- Red Collared Workers
- Sector - Livelihood from Natural Environment
- Hunting and Gathering
- Agriculture and Allied Activities
- Live Stock
- Apiculture
- Pisciculture
- Sericulture
- Mining and Quarrying
Mining - Mineral Resources from beneath the Ground
Ex Coal Mining
Quarrying - don’t Dig deeper, from Earths Surface
Ex Sand Quarrying, Granite Quarrying
Secondary Sector
People here are called as Blue Collared Workers
Manufacturing is Secondary sector
Processing of Raw Material
Construction Sector
because primarily materials used are raw materials
Tertiary Sector / Service Sector
People
People here are called White Collared Workers
Provides Services
- Hotel & Rest
- Financial Sector
- IT Sector
- Real Estate Sector
- Buying and Selling of Property - Tertiary
- Construction of Property - Secondary Sector
- Professional Services
Distribution of Goods
- Trade - Import and Export
- Retail and Whole Sale
- Transportation
Example
- Construction of Road - Secondary Sector
- Transportation on the Road - Tertiary Sector
Quaternary Sector
- Research & Development
- Knowledge based Economy
- Requires higher skill set in comparison to tertiary sector
- in India Quat Sector is not developed
- ES
- India - 0.7% of National Income on R&D
- China - 1.4%
- USA - 2.1%
- Israel - 4.2%
Differentiate Between Quaternary and Tertiary Sector
- After PHD
- Teaching - Tertiary
- in Research - Quaternary
Quinary Sector
- Also called as Gold Called Workers
- Highest Decision Makers in both Govt and Private Sector
- Home Makers
Mind Maps
Categorisation in India
Raw Data
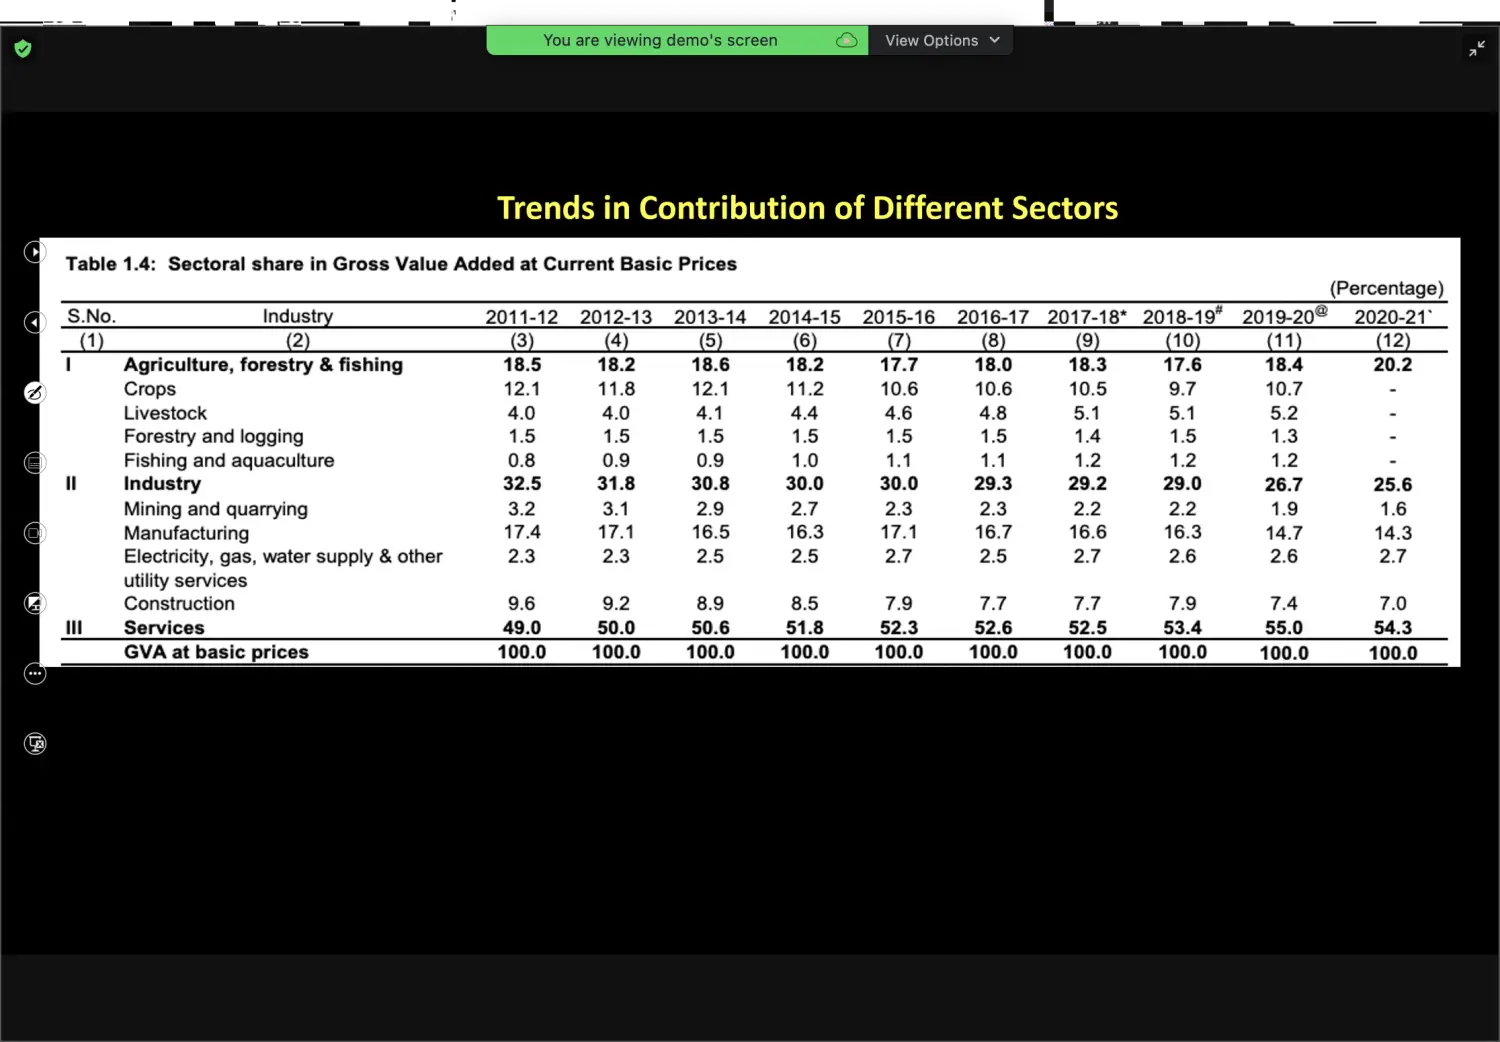
Agriculture
- AFoFi - Agriculture Forestry Fishing
- General Question is in form of Trends
Agriculture Contribution from 2011-12 to 2019-20
It has remained constant
2020-21 - Share Increased
Year of Covid
Decline in Manufacturing and Services, they both are Contact Intensive
Hence Relatively Agri Contribution has increased
- Sub Sector Highest Contribution - Crops
Industry
Sub Sector
Mining & Quarrying
Manufacturing
Construction
Electricity - EG WU - एग वू
Gas
Water Supply
Other Utility Services
Trends
Share of Industry has Decreased
Contribution of Manufacturing Sector to
- GDP 17%
- Employment 12%
Remains Stagnant
Services
- Share of Service Sector has Increased
Trend To Remember

Only Remember the Highest and Lowest in Sub Sector
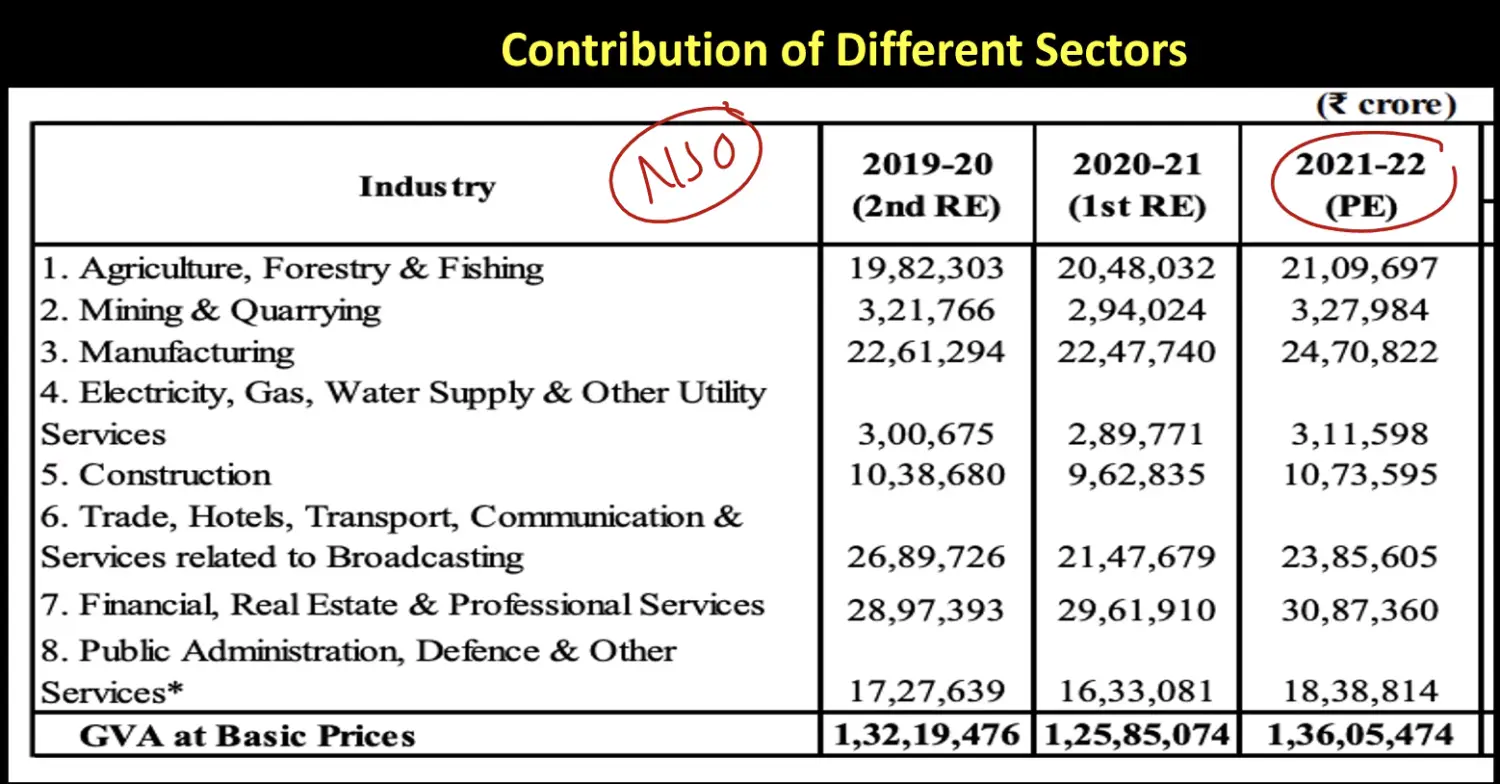
Contribution in Employment & GDP
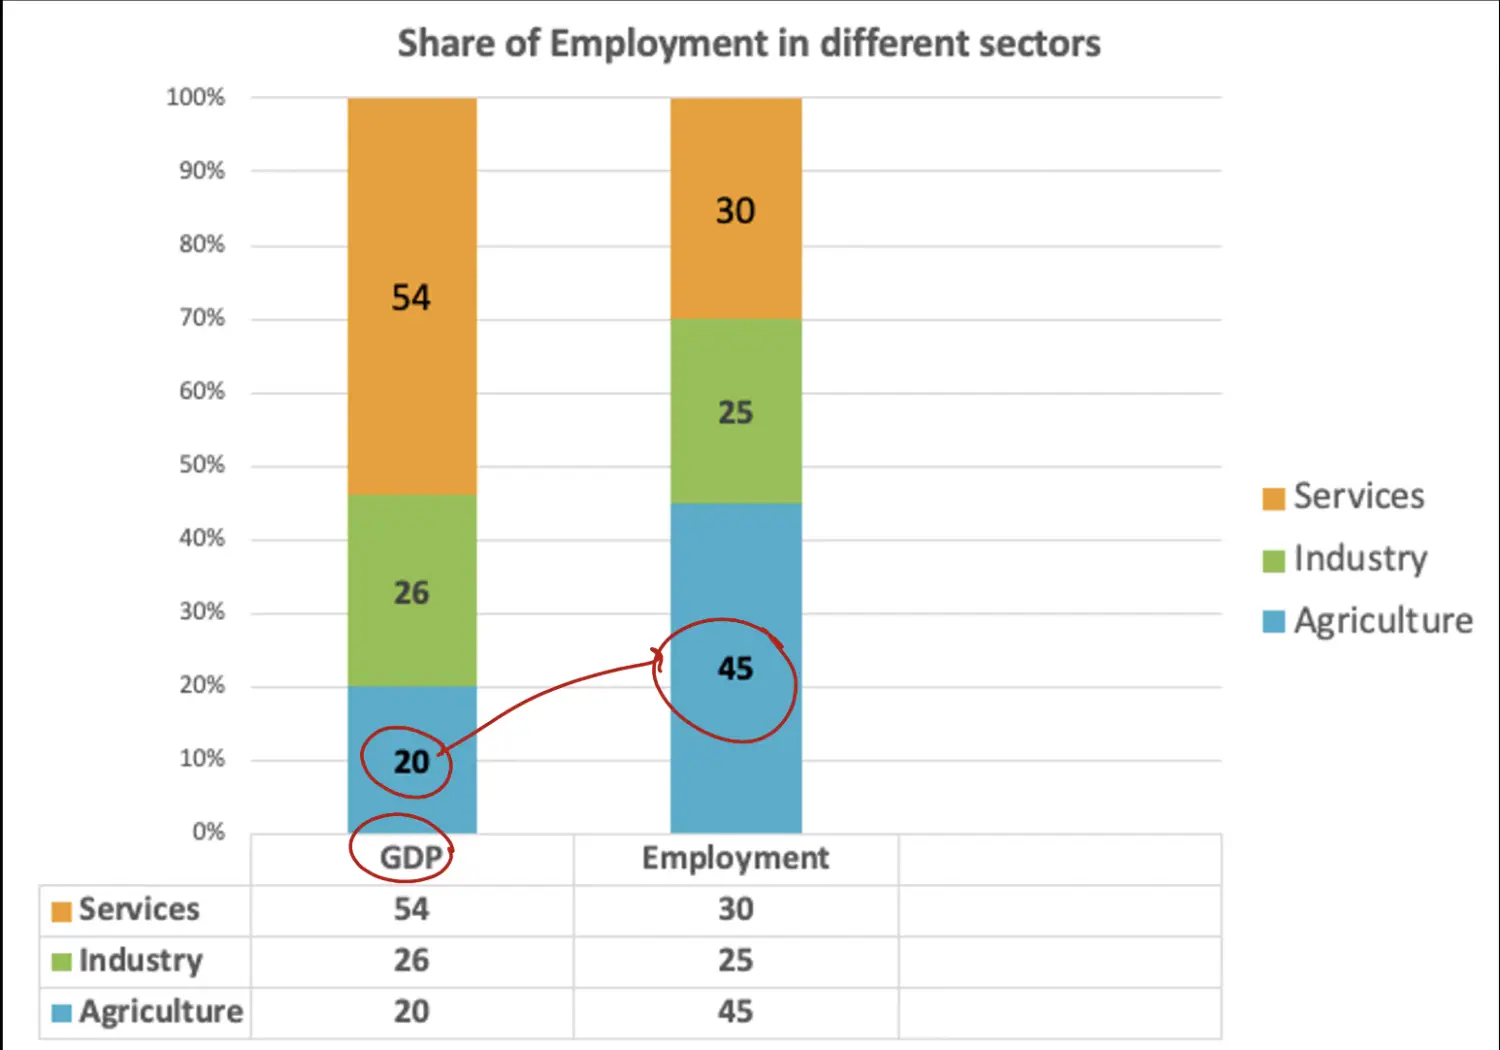
Over All Trend
Industry Sector
Contribution Constant
Employing Constant
Service Sector
Contribution is High
Employing Less
Agri Sector
Contribution is Less
Employ Less
Agriculture Sector
- Disguised Unemployment
- Person is working - Contribution is Zero
- Even if he is taken out, the Productivity will not be hampered
- Example of Agriculture Land in India
- Why such levels of Disguised Unemployment ?
- No Educational Qualification
- No Proper Skill Set
- Getting Employed in Manufacturing and Services Sector is not an option
- Solution
- Skill Set for Family of Agriculture
- So that these people can move towards manufacturing or services
- After Solution Situation
- What if Employment in Agriculture falls below the people needed
- Two Fold Strategy
- Increase Skill Set
- Productivity of Agriculture
- Mechanisation
- High Yield Seeds
- Adoption of Technology
- Improving Agriculture Marketting
Premature Deindustrialization
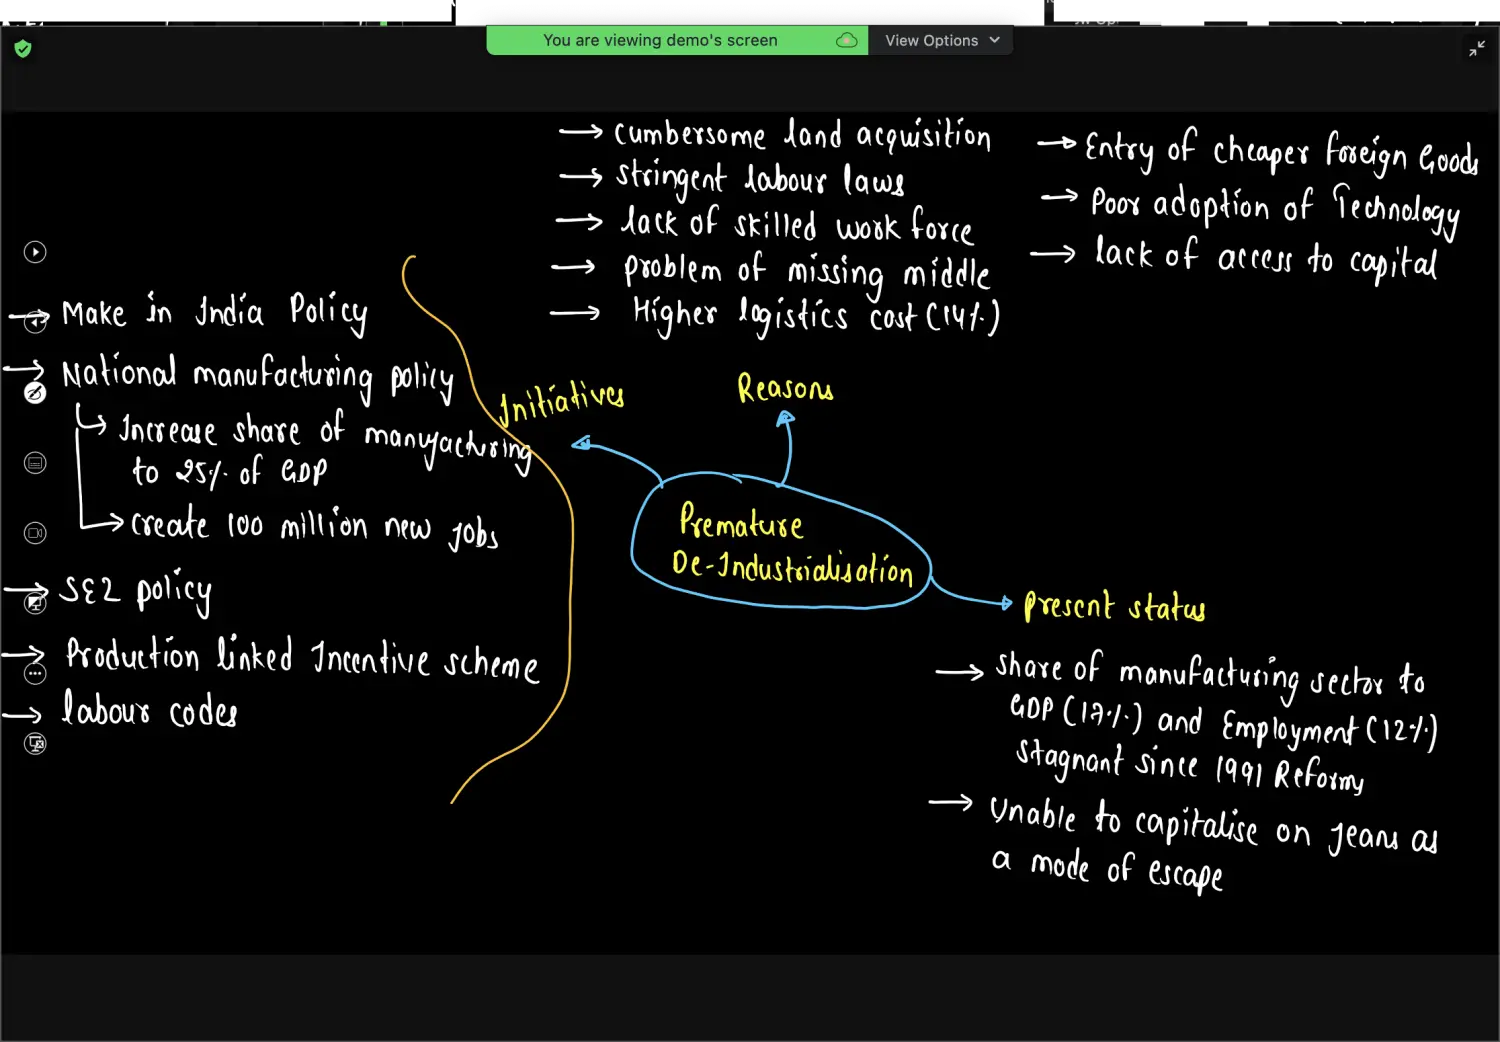
Structural Transformation
- Agriculture
- Manufacturing
- Services
Introduction
Examples
US - Developed - Service Dominant
China - Ex of Matured Industrialisation
1950 - 1980 → Agriculture
1980 - 2022 → Developing - Manufacturing
Reason for Manufacturing Hub
- Lowest Labour Cost
- Attracts Large no of MNC to MF in China
Examples : iPhone
Made in China
Made by USA
Examples : Samsung
Made in China
Made by Korea
One Child Policy - Less Population - Labour Cost Increase - MNC Shift to Vietnam and Bangladesh
in 1970-80
- China After Maturing of Agriculture
- Shifted to Manufacturing
- but India Jumped from Agriculture to Services Directly → Pre Mature De Industrialisation
Modes of Escape for Poverty
Geography
Tourism - Northern European Countries
Geology
Tapping into Natural Resources
Middle East, Australia, Canada
Jeans
Low Cost Manufacturing
Reasons why India missed the Bus to a Manufacturing Hub
Closed Economy 1947-91
- No Private Participation
- Monopoly of PSU’s
Land Acquisition Law
- By an Archaic Law of 1894
- In India it is Time Consuming, Cumbersome
- Leads to Social Conflict
Stringent Labour Laws - Concurrent Lists
Centre 44 , State > 100
IDA - Industrial Disputes Act
Applies to People of > 100 Workers
Owners have to take prior approval of govt to fire someone from the company
Hence, 90+Contractual
Problem of Missing Middle
Background
- Industries - Small Medium Large
- Few Large Industries
- Near Absence of Medium Size Industries
- Large Number of Small Industries
Reasons
- If I become a Medium Industry, Small Size Industry Incentive will be lost
👨🏫 In India Incentive to keep being Smaller is more than the Incentive to Grow LargerEase of Doing Business not present
Categorisation of Sectors as Organised & Unorganised
Categorisation of Industry
Different Sources have different criteria for deciding a sector to be Organised or Unorganised , But According to ES it is
| Themes | Organised | Unorganised | | --- | --- | --- | | Defintion (Condition is of &&) | 1. Employs More than 10 or more Person 2. Comes Under Govts Regulation | 1. Employs Less than 10 Percent 2. Normally, not under Govt Regulation | | Example | 1. Patanjali | 1. Agriculture 2. Industrial Workers 3. Self Employment | | Facts | 19% in Organised Sector | 81% in Unorganised Sector |
| Formal Worker | Informal Worker | Meaning | | --- | --- | --- | | Job Security | No Job Security | Permanent Employee | | Work Security | No Work Security | If Suffers an accident during course of work, he is entitled to Compensation | | Social Services | No Social Security | Example : 1.Pension or Insurance 2.Provident Fund 3. EPF |
Informalisation of Indian Work Force
- Organised Workers
- 10 or More && Under Govt Regulation
- Workers
- Formal - 49%
- Informal - 51%
- Unorganised Sector
- Less than 10 Workers && Not Under Govt Regulations
- Workers
- Formal - 00.7%
- Informal - 99.3%
- Organised Workers
Does Unorganised Sector Contribute towards GDP
We directly measure production of Goods and Services from Organised Sector
And then Make Inference for Unorganised Sector because the Calculation is very tough
During De Monetisation Unorganised Sector got more affected
Mind Map
Circular Flow of National Income
Introduction
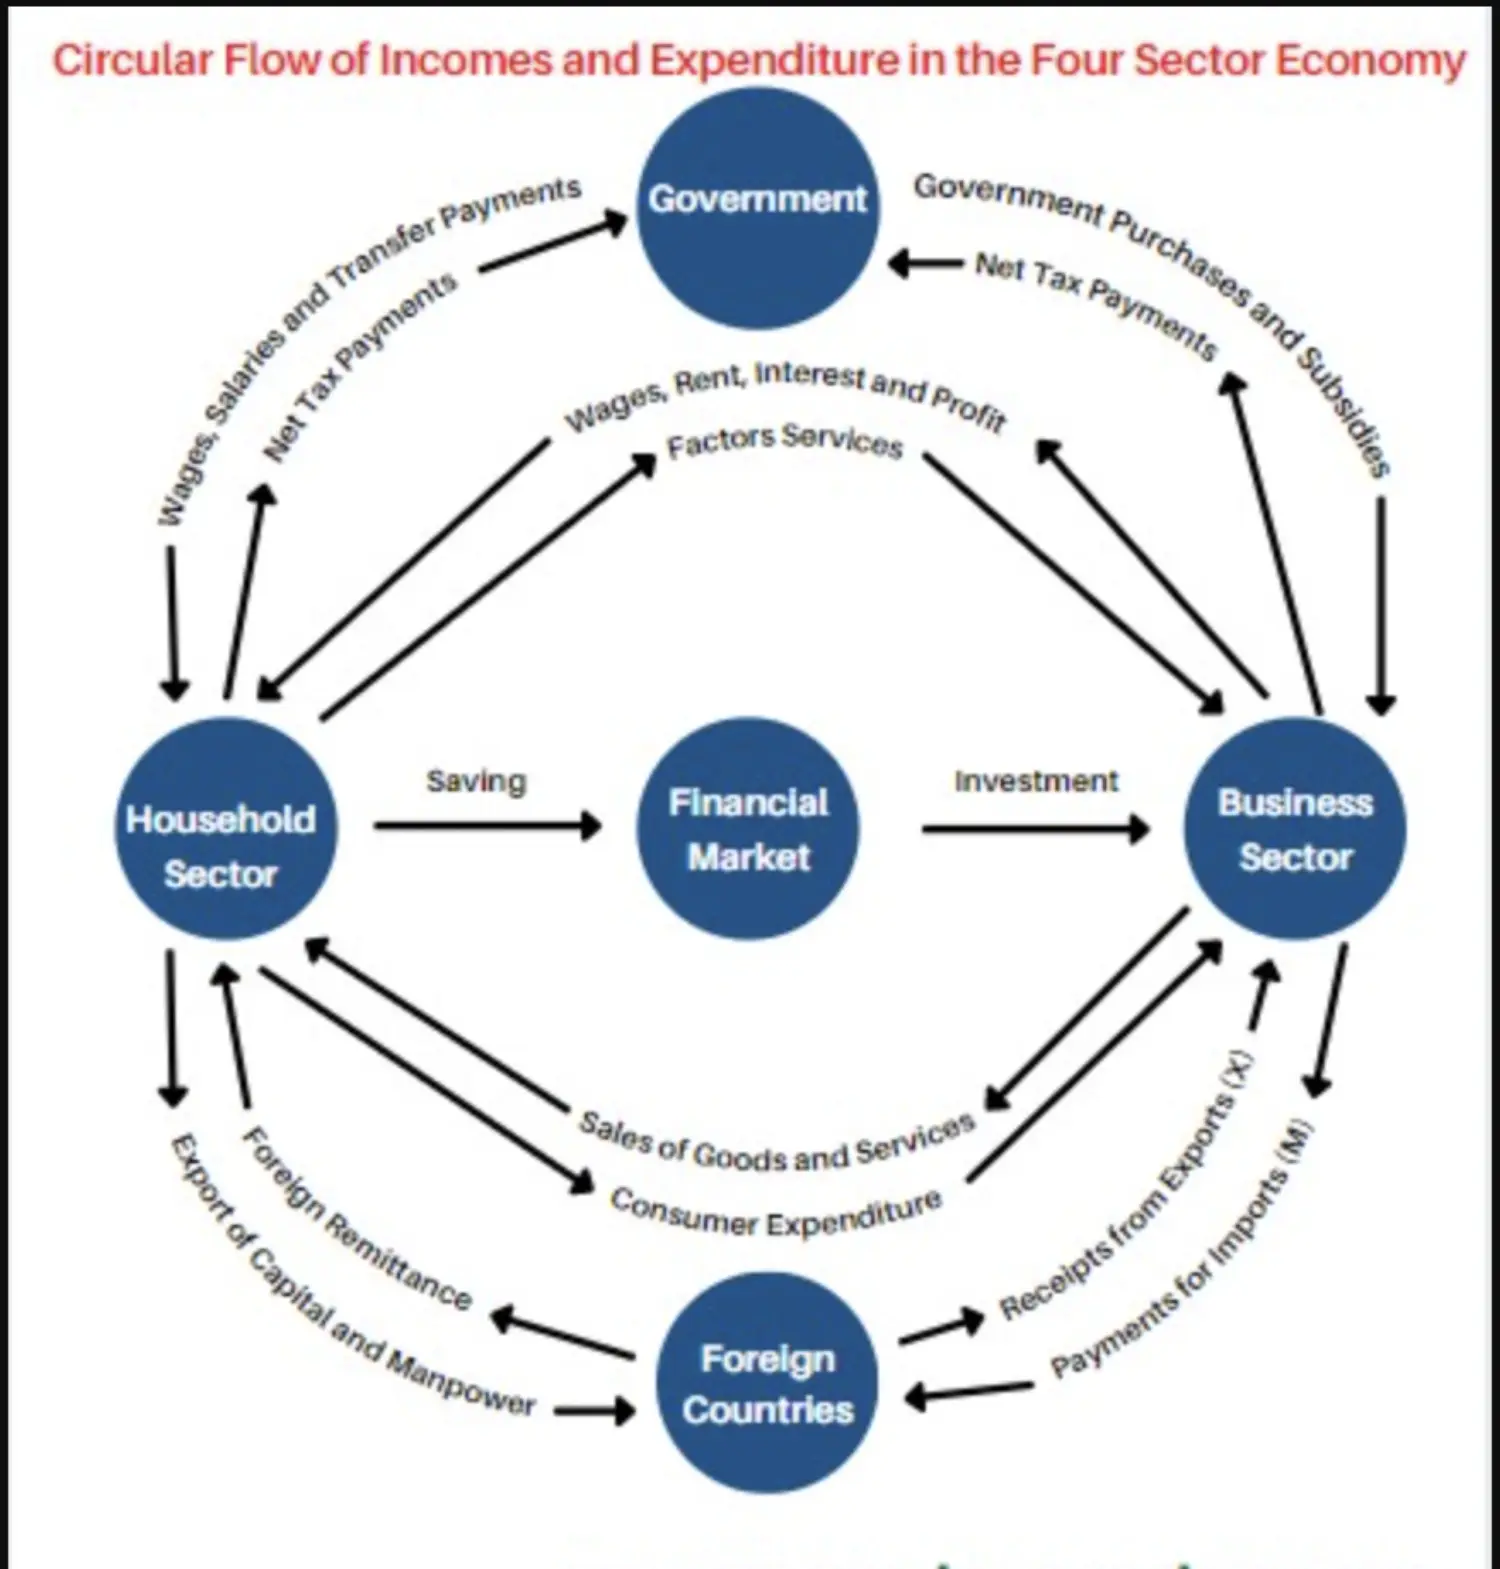
- There are 4 Sectors in an Economy
- Household
- Private
- Government
- External Sector
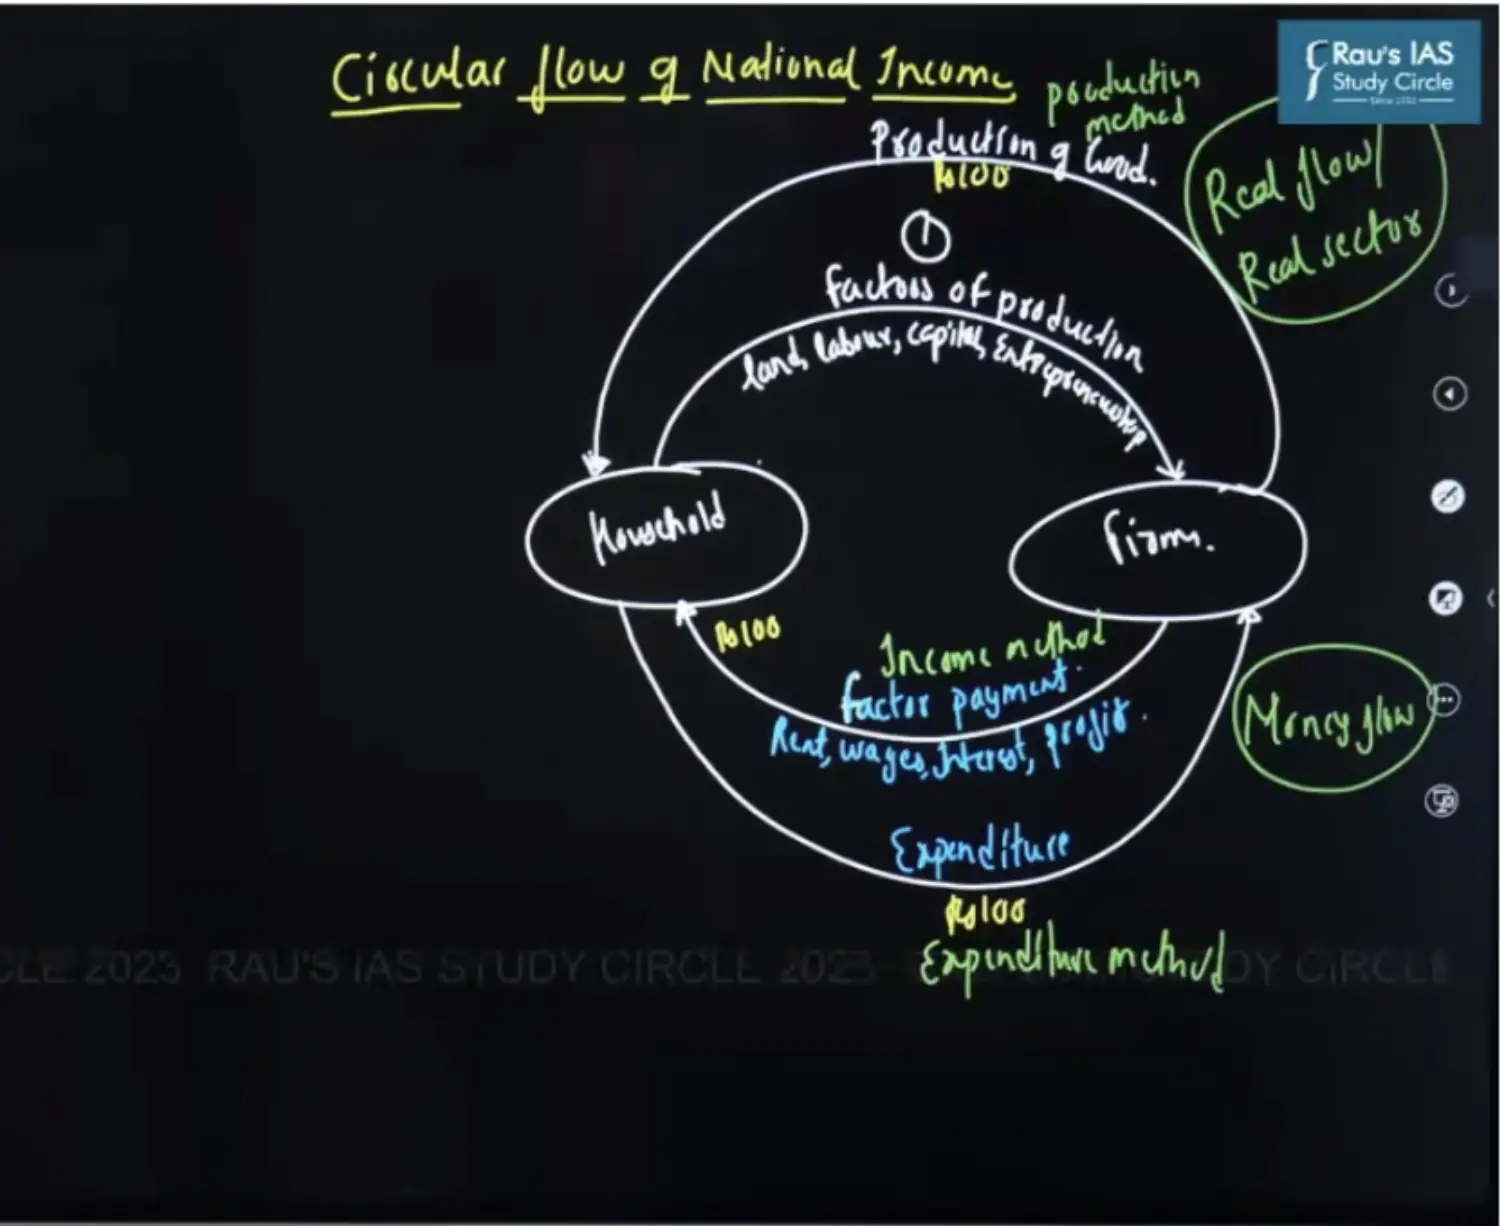
- There is always free flow of Goods and Services between these Sectors
- Factors of Production - Land Labour Capital Entrepreneurship
- Factor Payments - Rent Wages Interest Profit
- Concept of
- Real Flow
- Money Flow
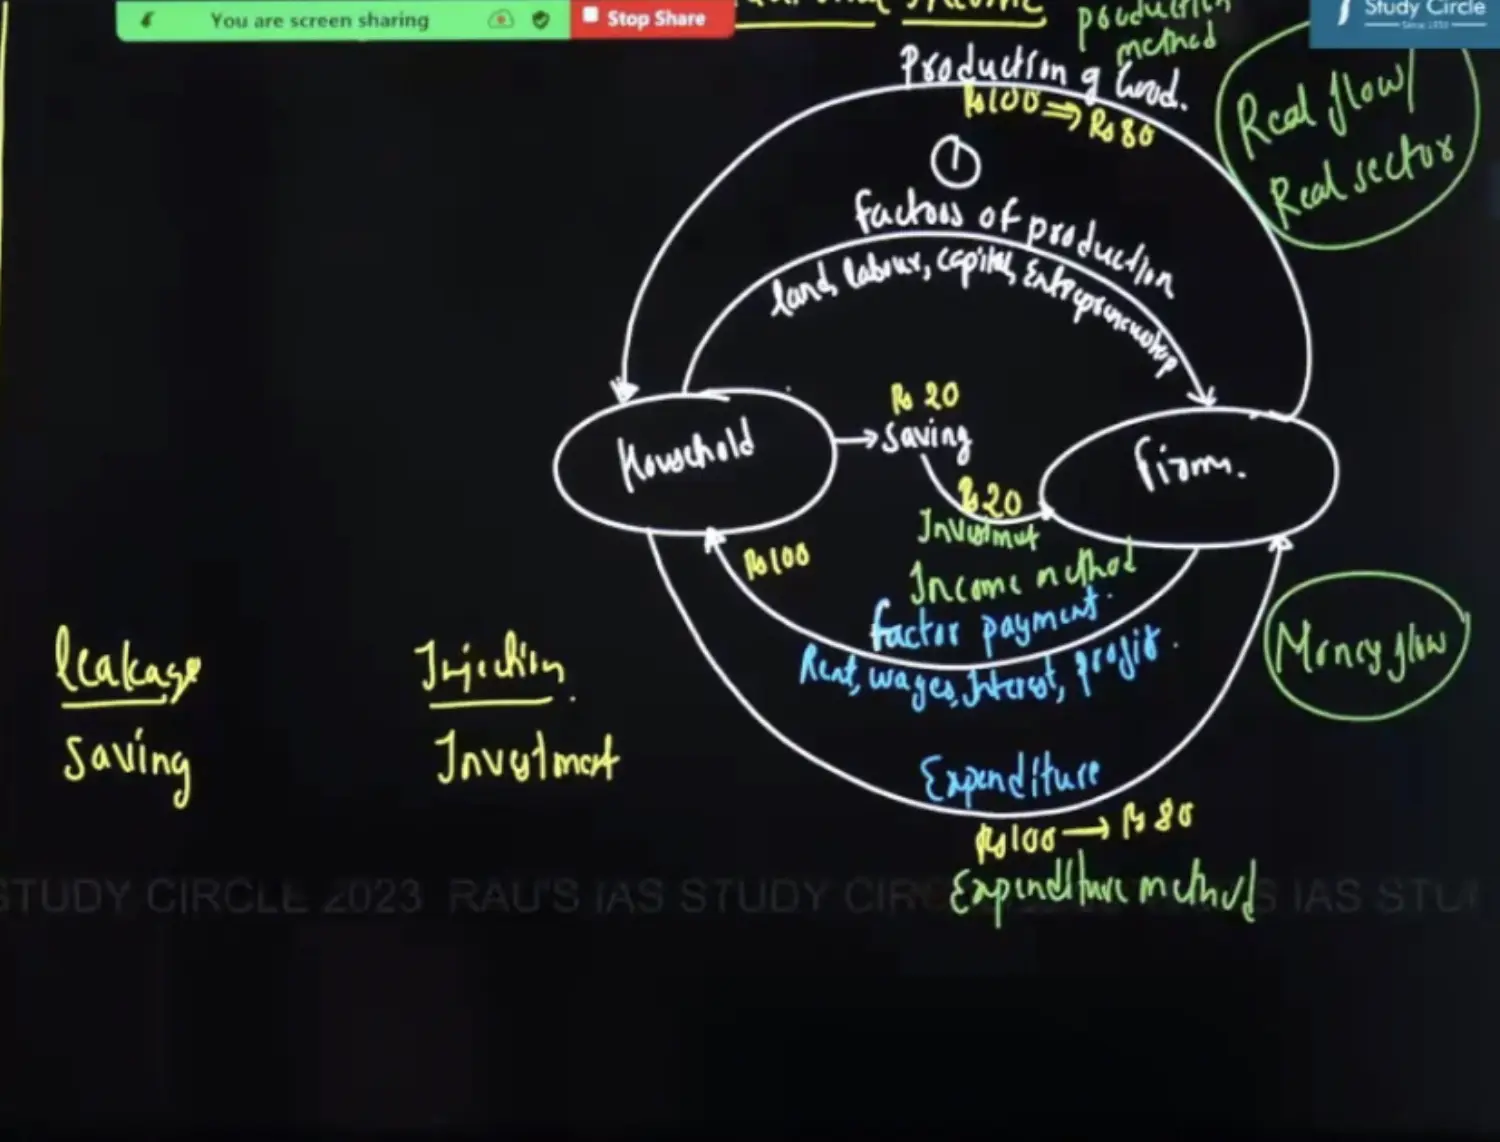
- Leakages
- Injections
- There are 4 Sectors in an Economy
Models
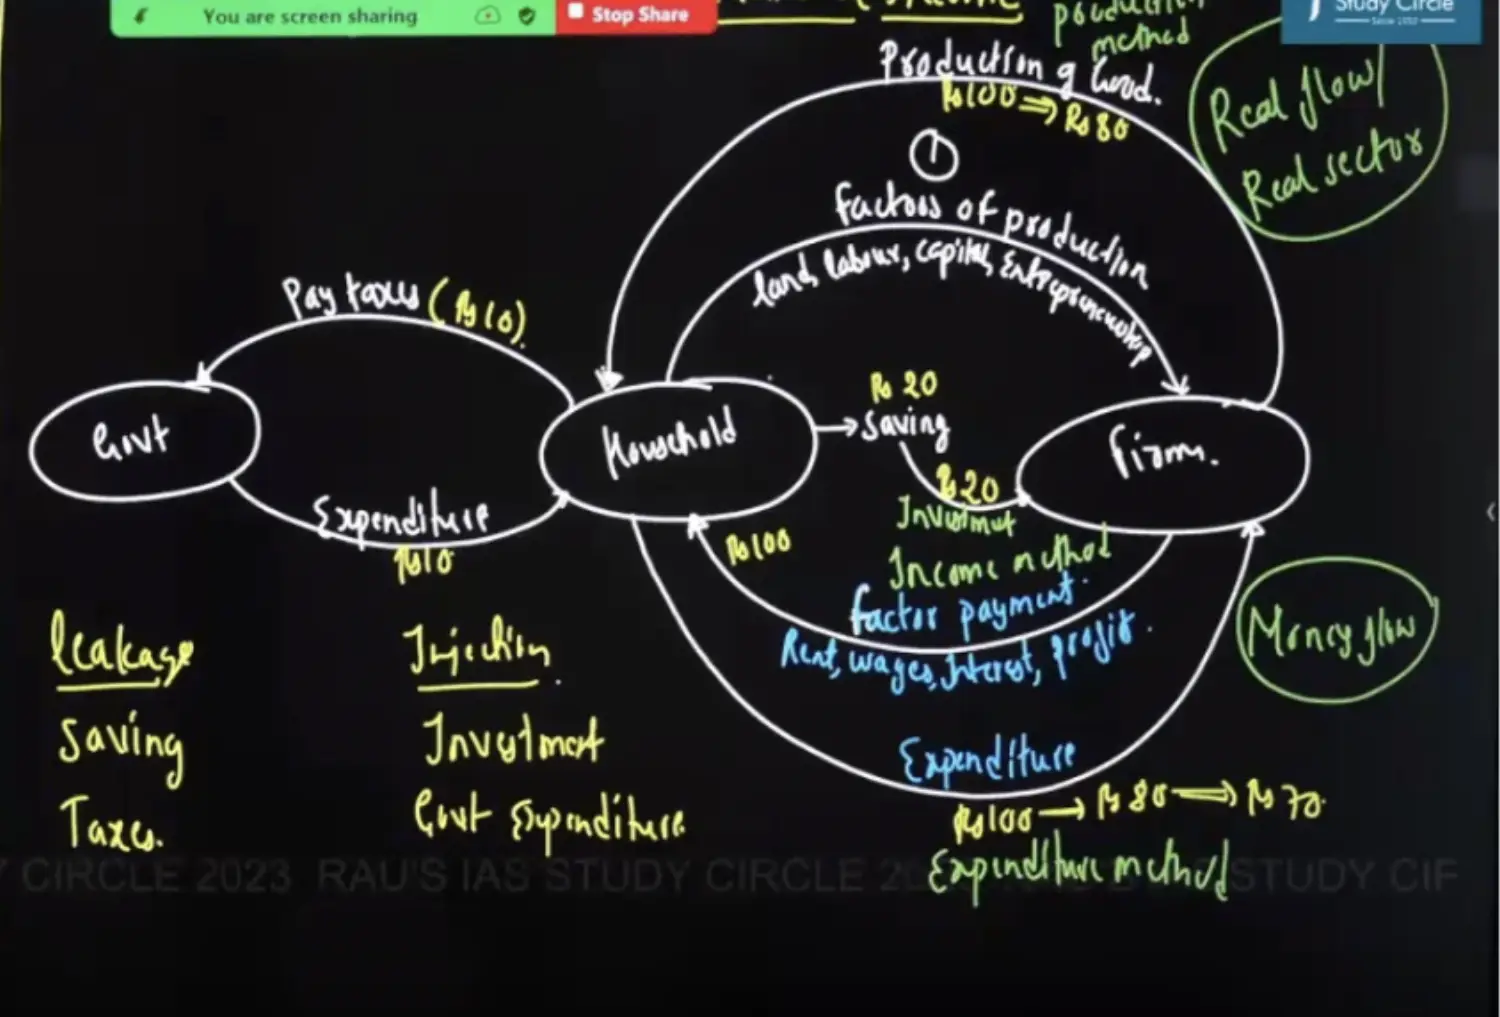
Two Sector Model - Household and Firms
Place where actual production takes place is called as Real Sector
Whereas, Place of Money Flow is called Money Sector
Savings are Leakages as Money is going out of Flow.
Here Injection is in the form of Investment
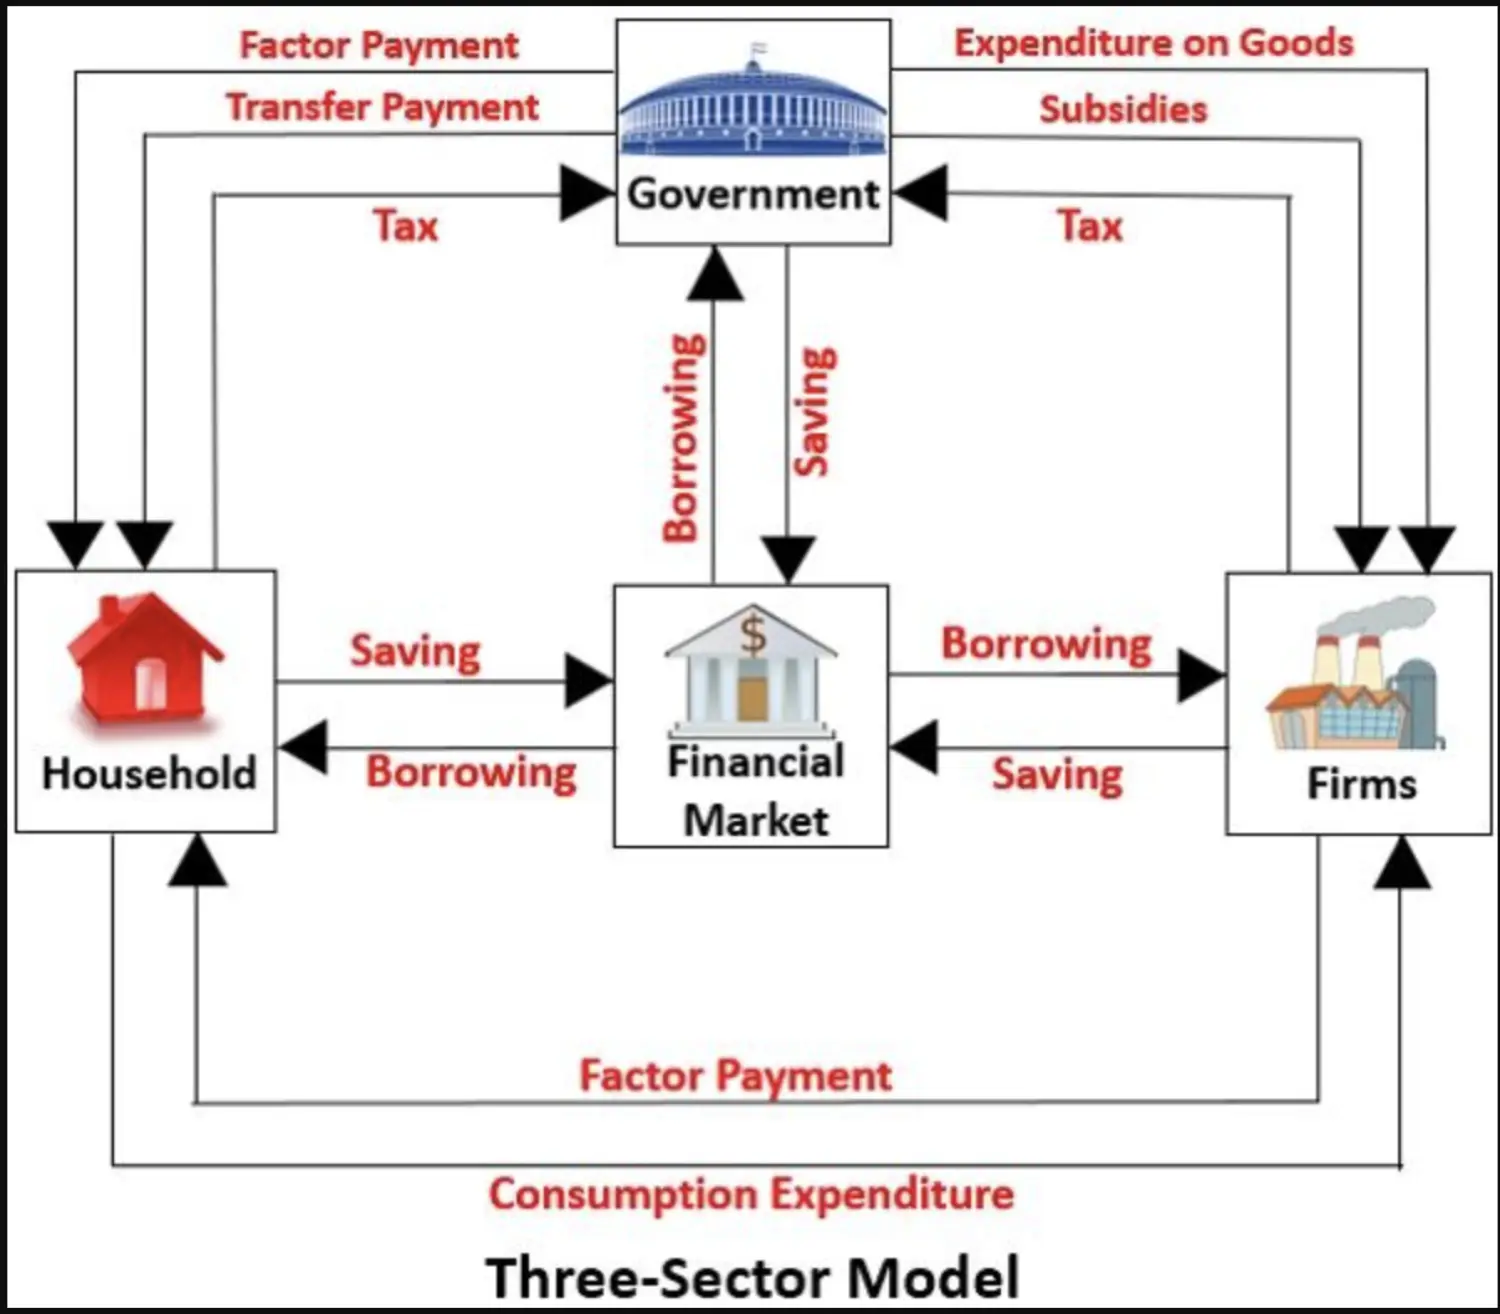
Three Sector Model - Household, Firms & Govt
Four Sector Model - Household, Firms, Govt, External Sector
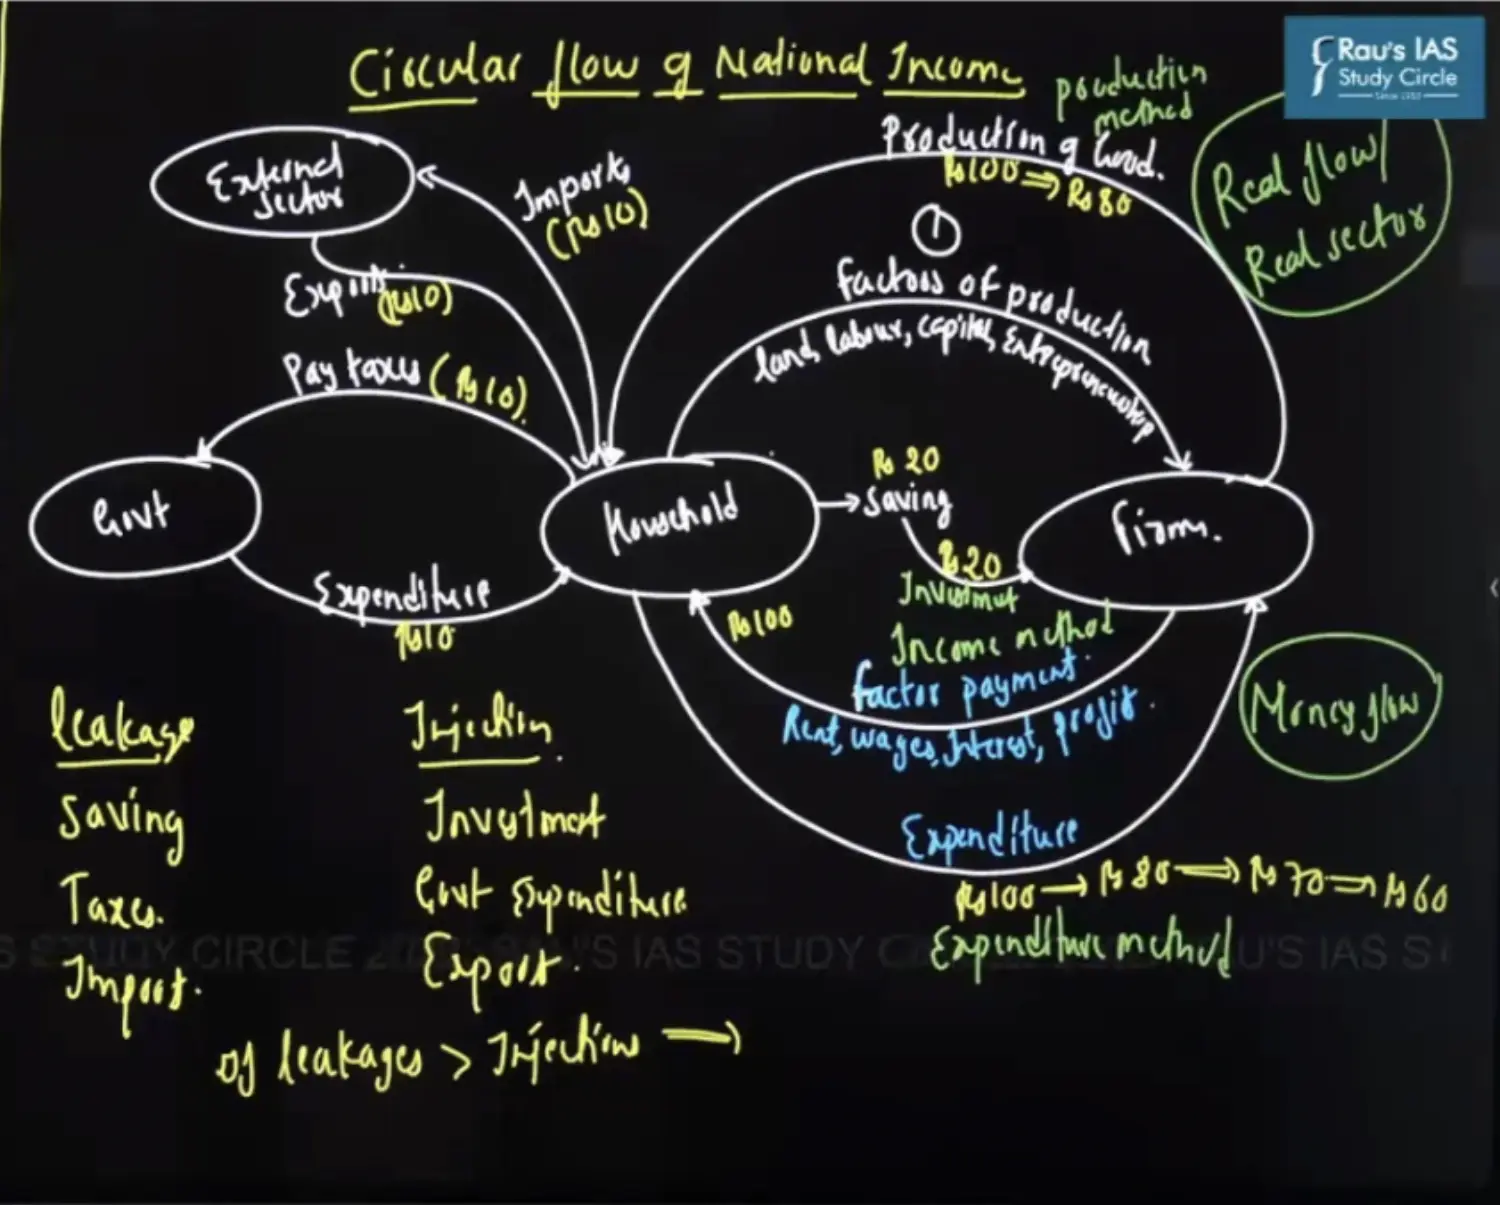
Cases of Leakages & Injections
Leakages > Injections → GDP Decreases
Injections > Leakages → GDP Increases
Practise Questions
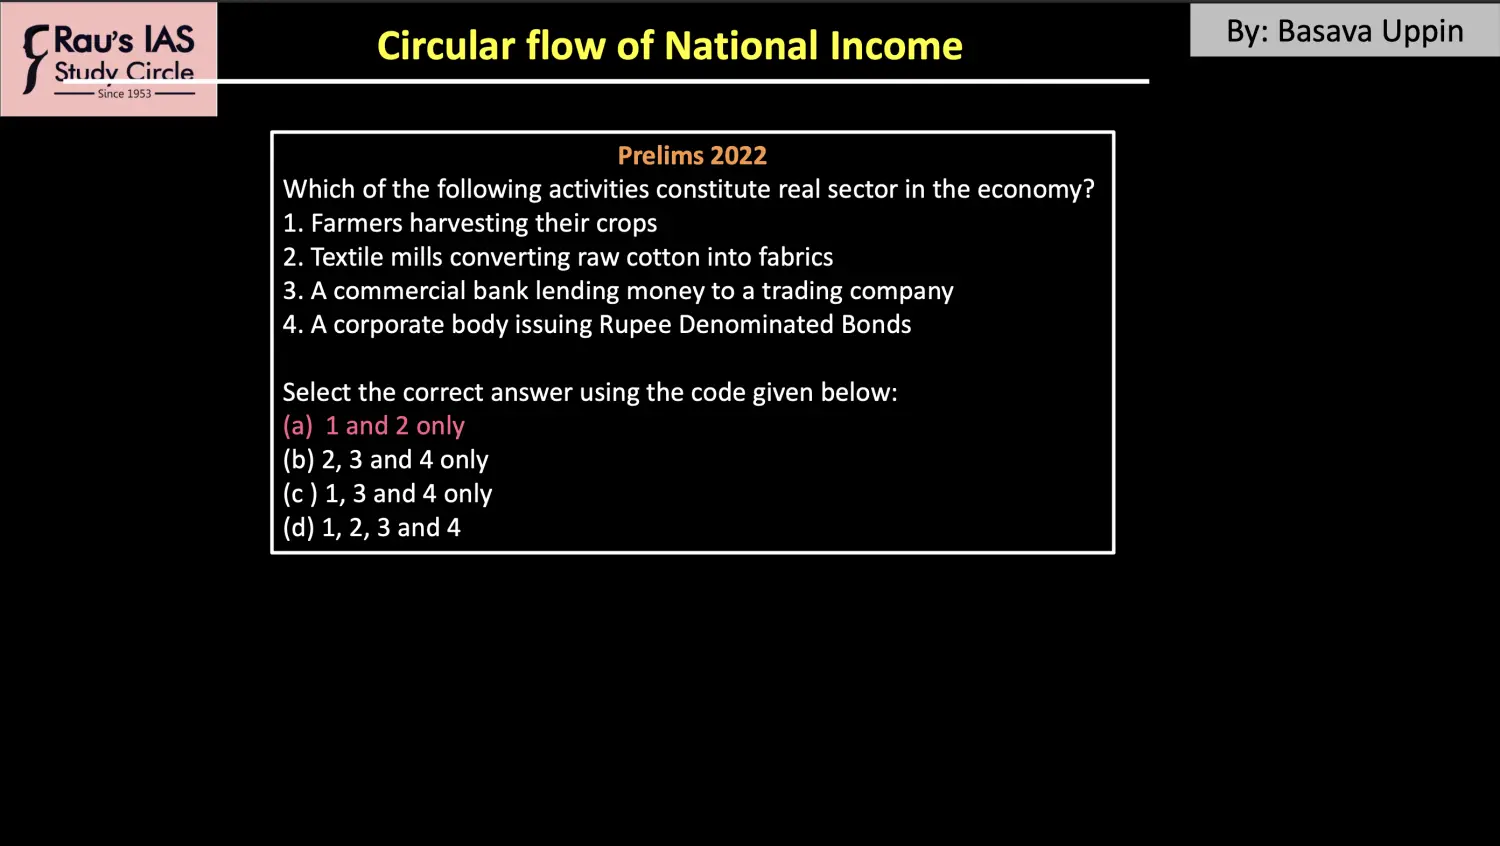
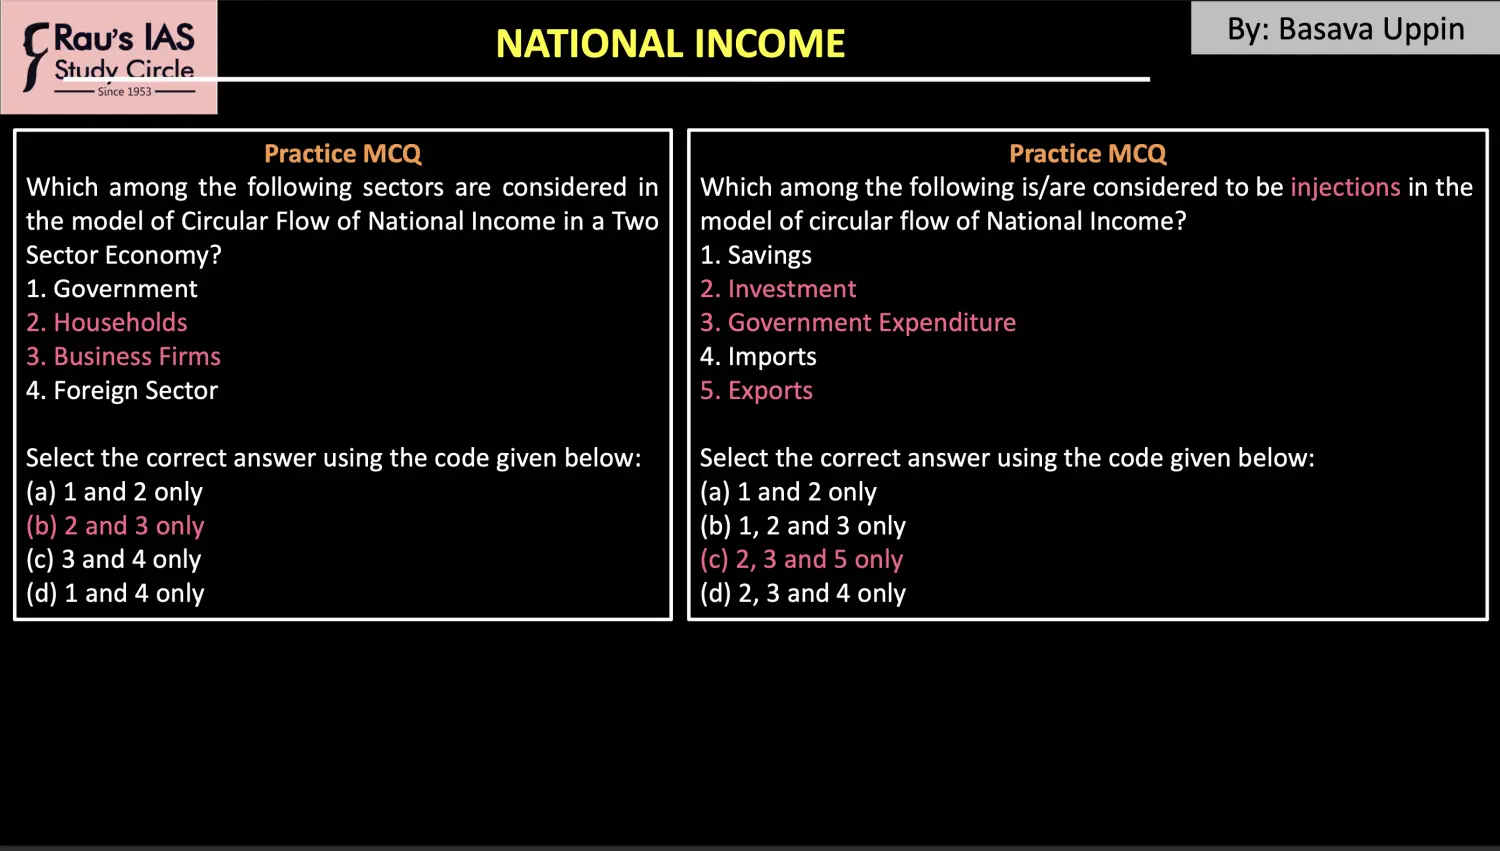
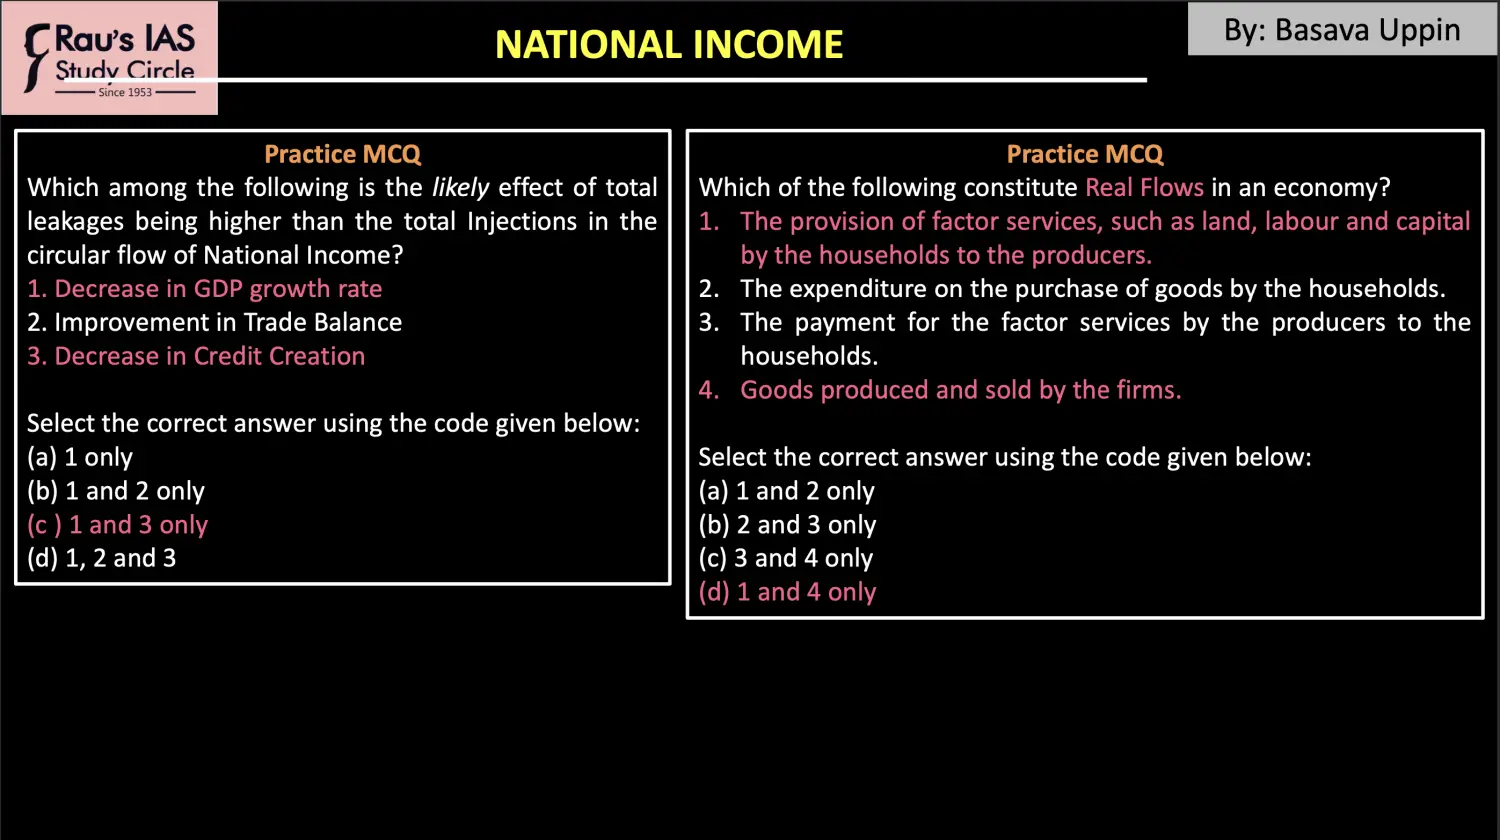
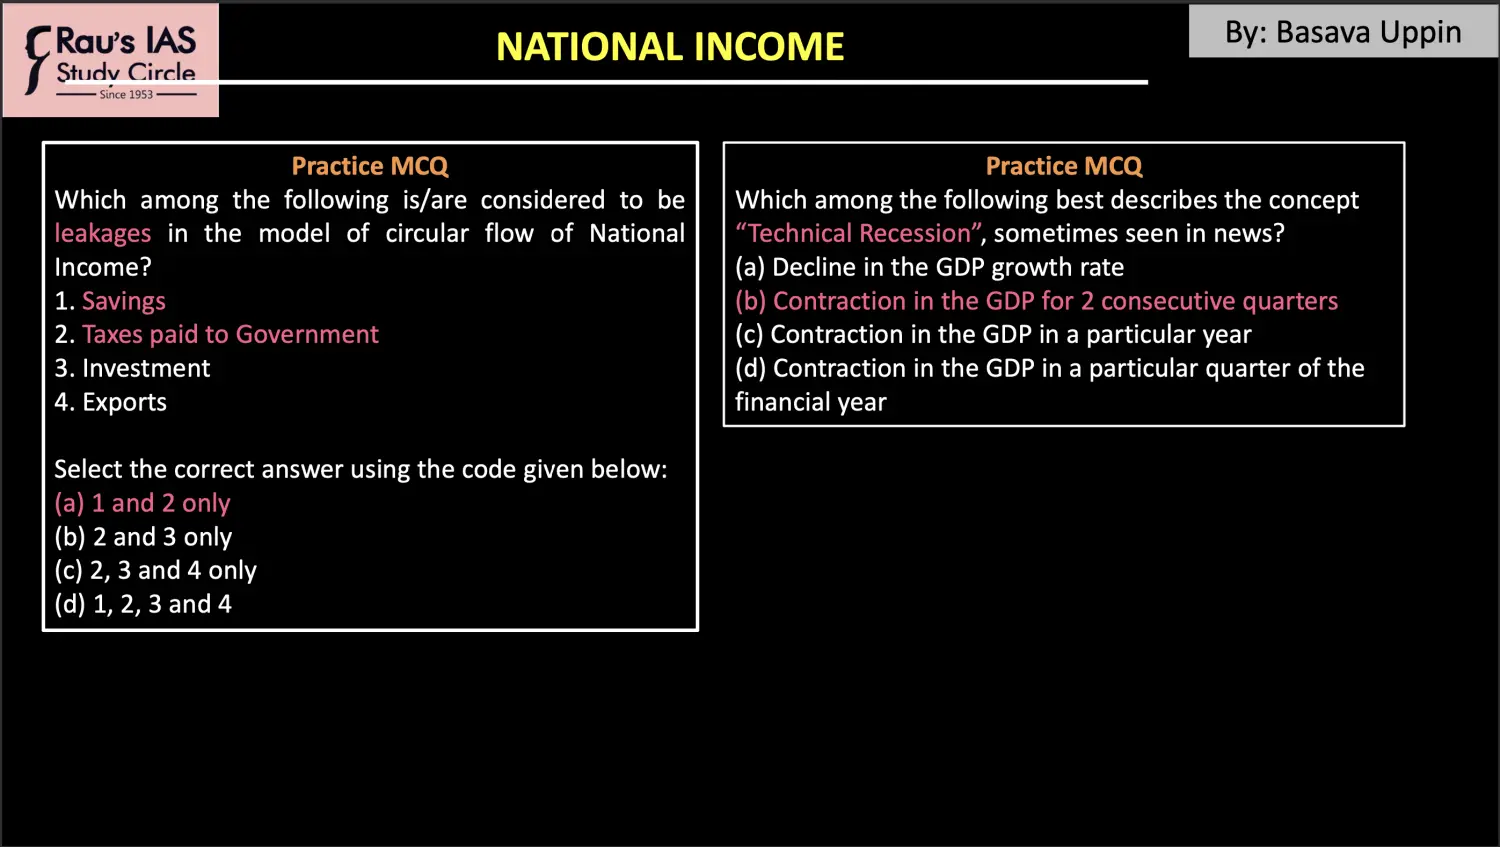
Contraction is Negative GDP Growth Rate
GDP - Gross Domestic Product
Introduction to GDP
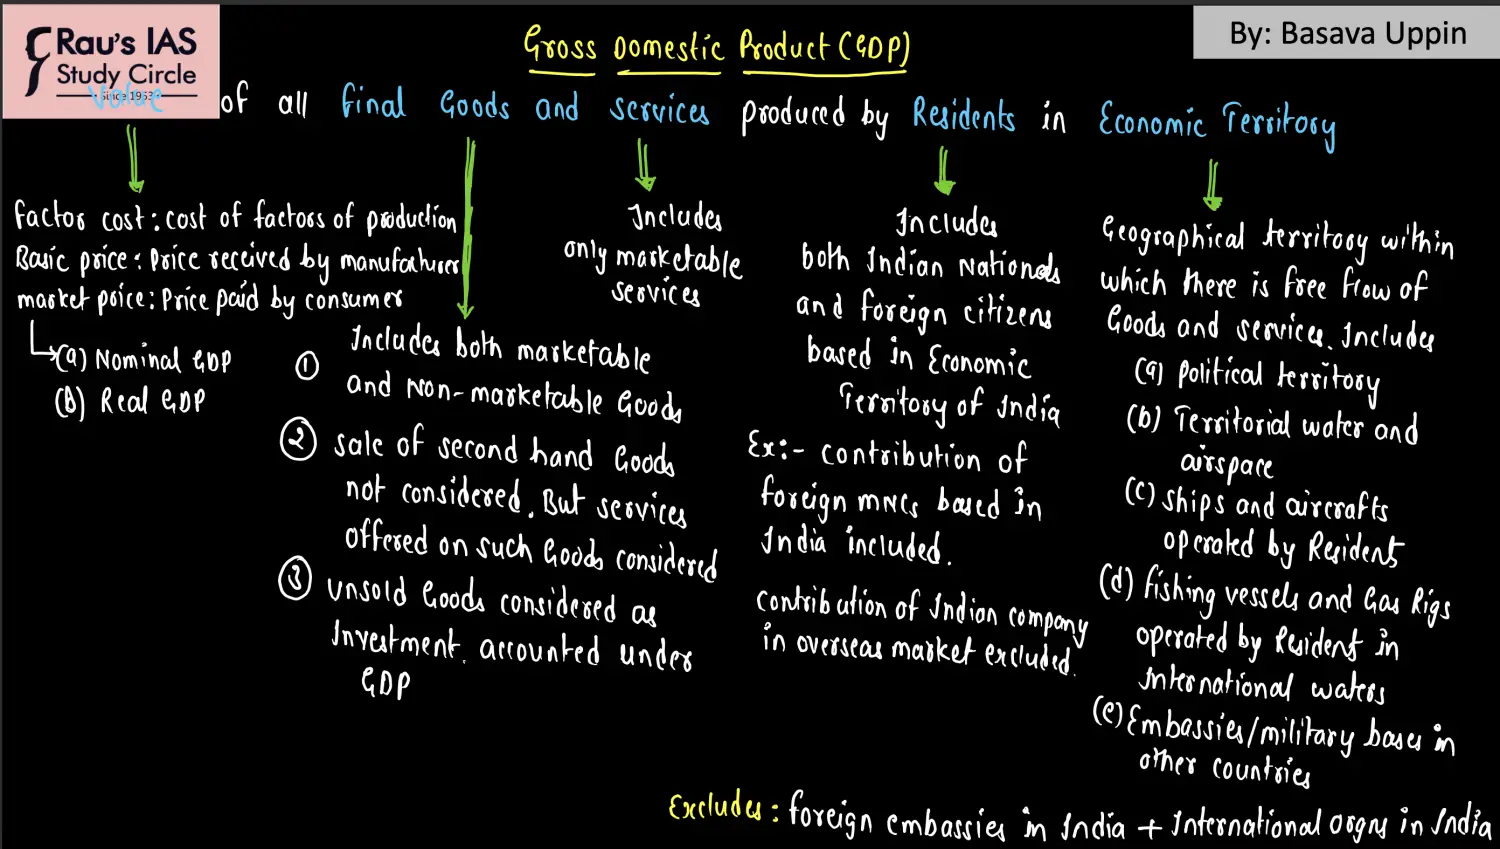
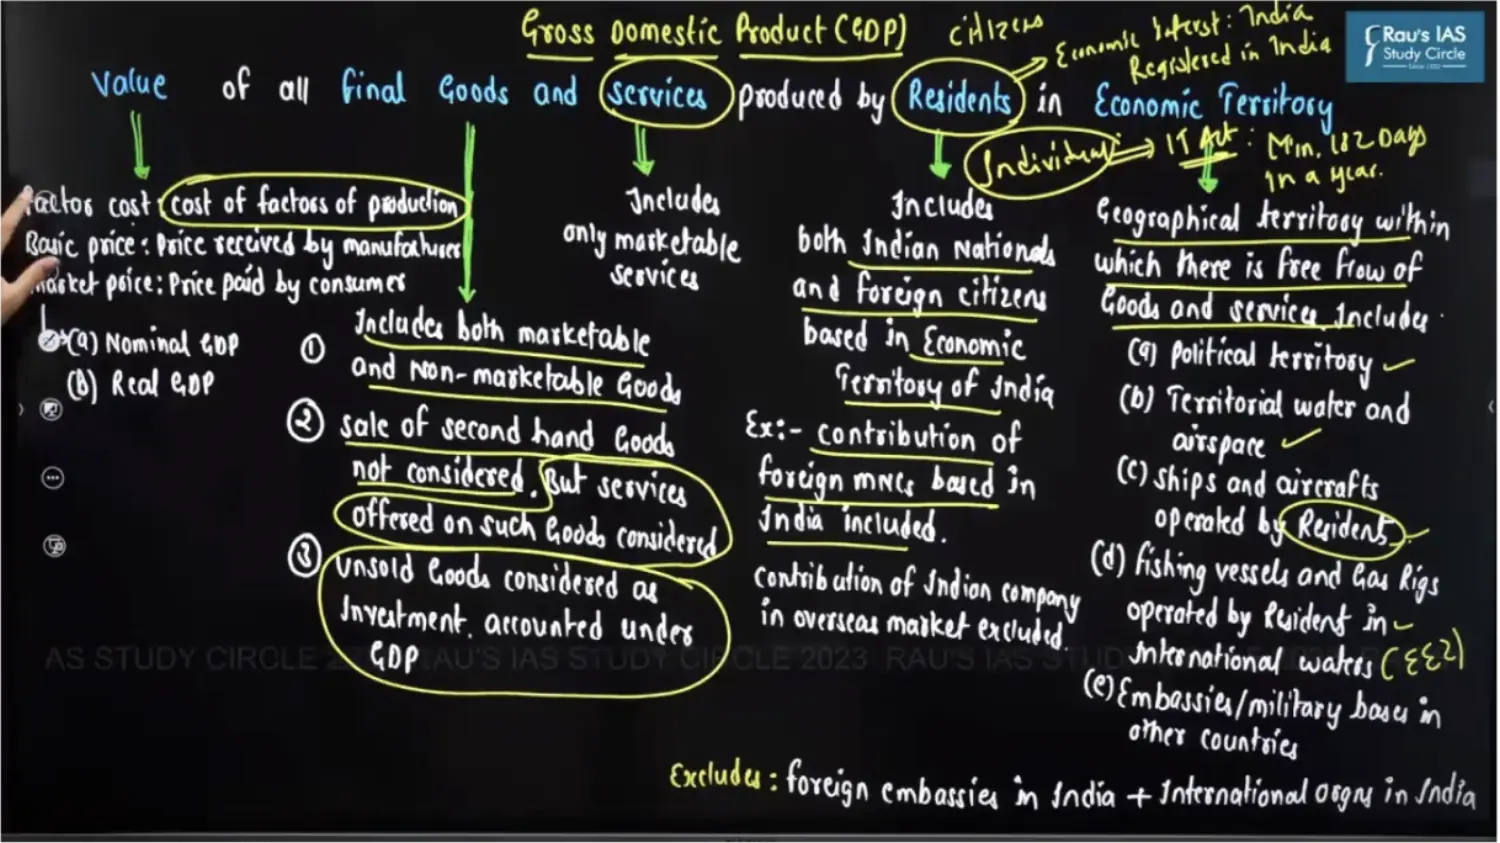
Indian Resident : Min 182 Days in a Year acc to IT Act
Services → Only Marketable Included in GDP
Marketable : It is paid
Non Marketable : It is unpaid ; Painter Painting his home ; I cook for myself
Goods → Both Included in GDP
Marketable : For Selling in Market
Non Marketable : For Self Consumption
Basics to Understand GDP
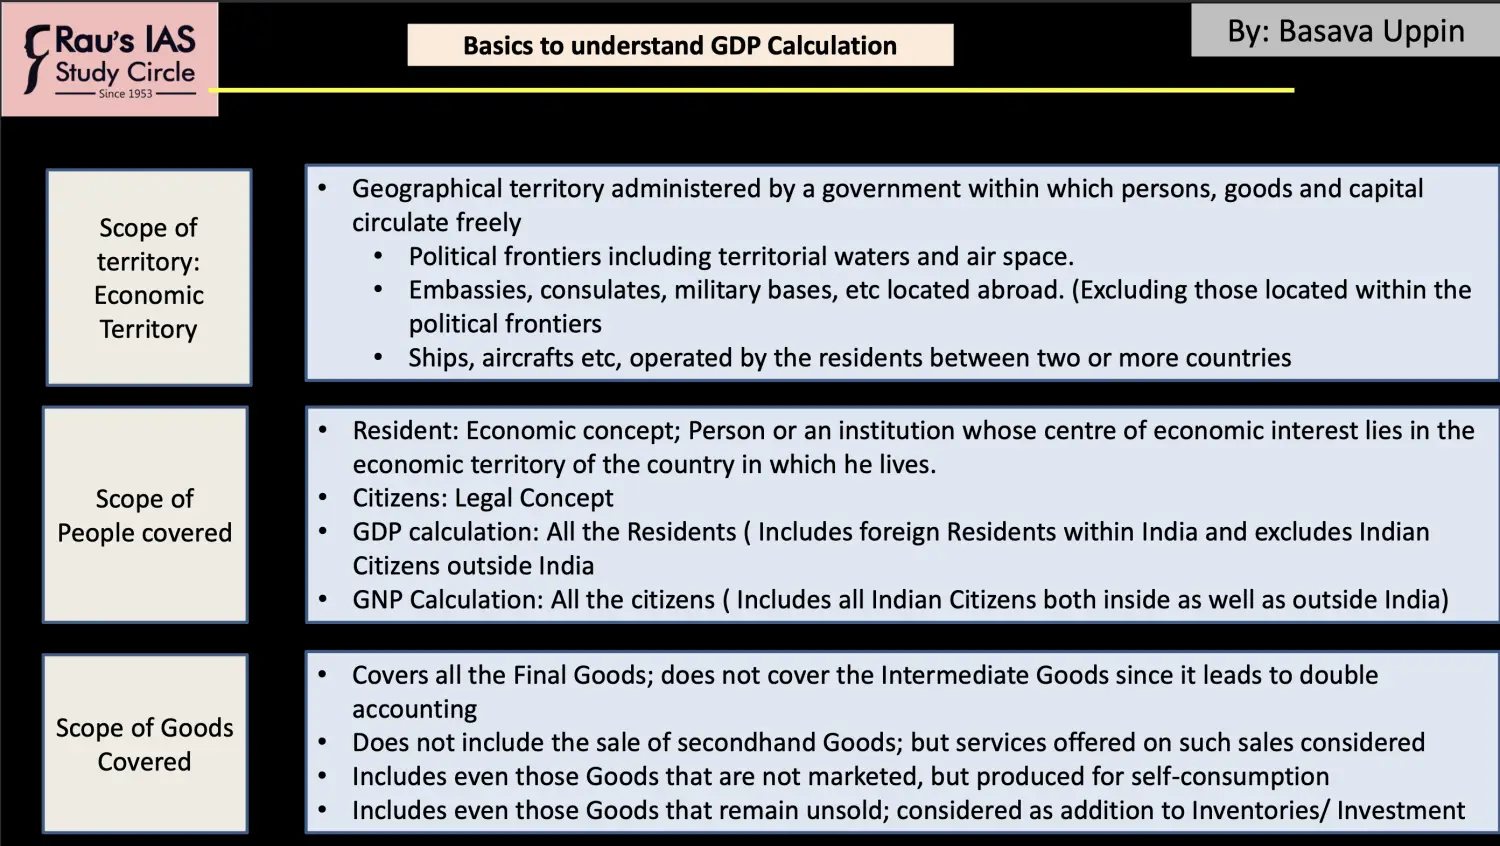
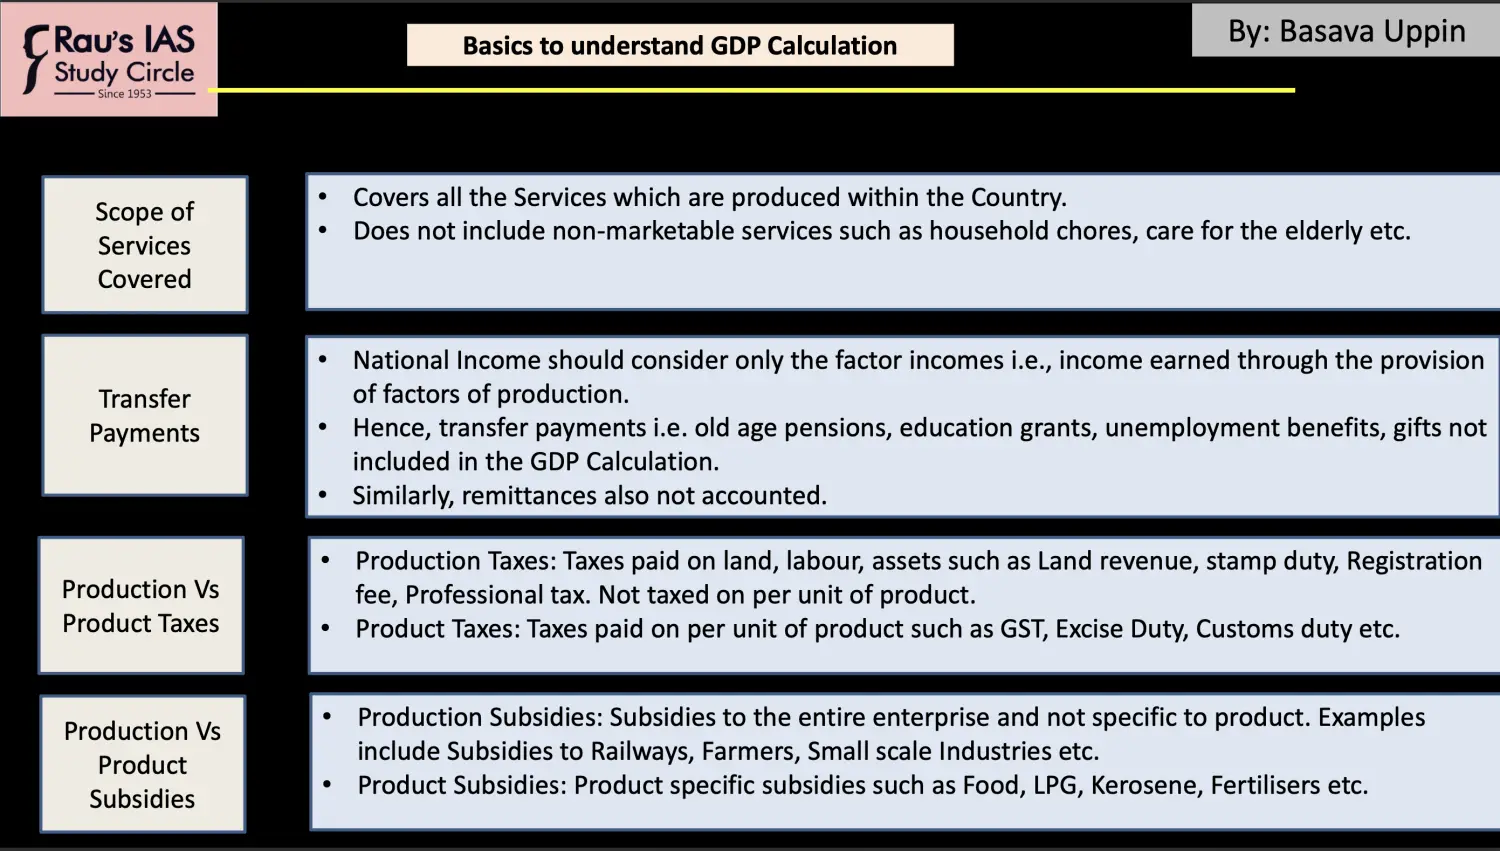
Difference Between Factor Payments and Transfer Payments
Factor Payment : Wages, Interest, Profit & Rent Received due to Land, Labour, Capital & Entrepreneurship
Transfer Payment : Payments without providing Factors of Production like Old Age Income, Grants etc
Transfer Payment is not included as including them would lead to Double Accounting
Types of Pensions
Old Age Pensions to Poor People → Transfer Payment
Pensions to Govt Officials → Factor Payment → Included in GDP
In General Pension is considered to be Old Age Pension which is Transfer Payment
Practise Question
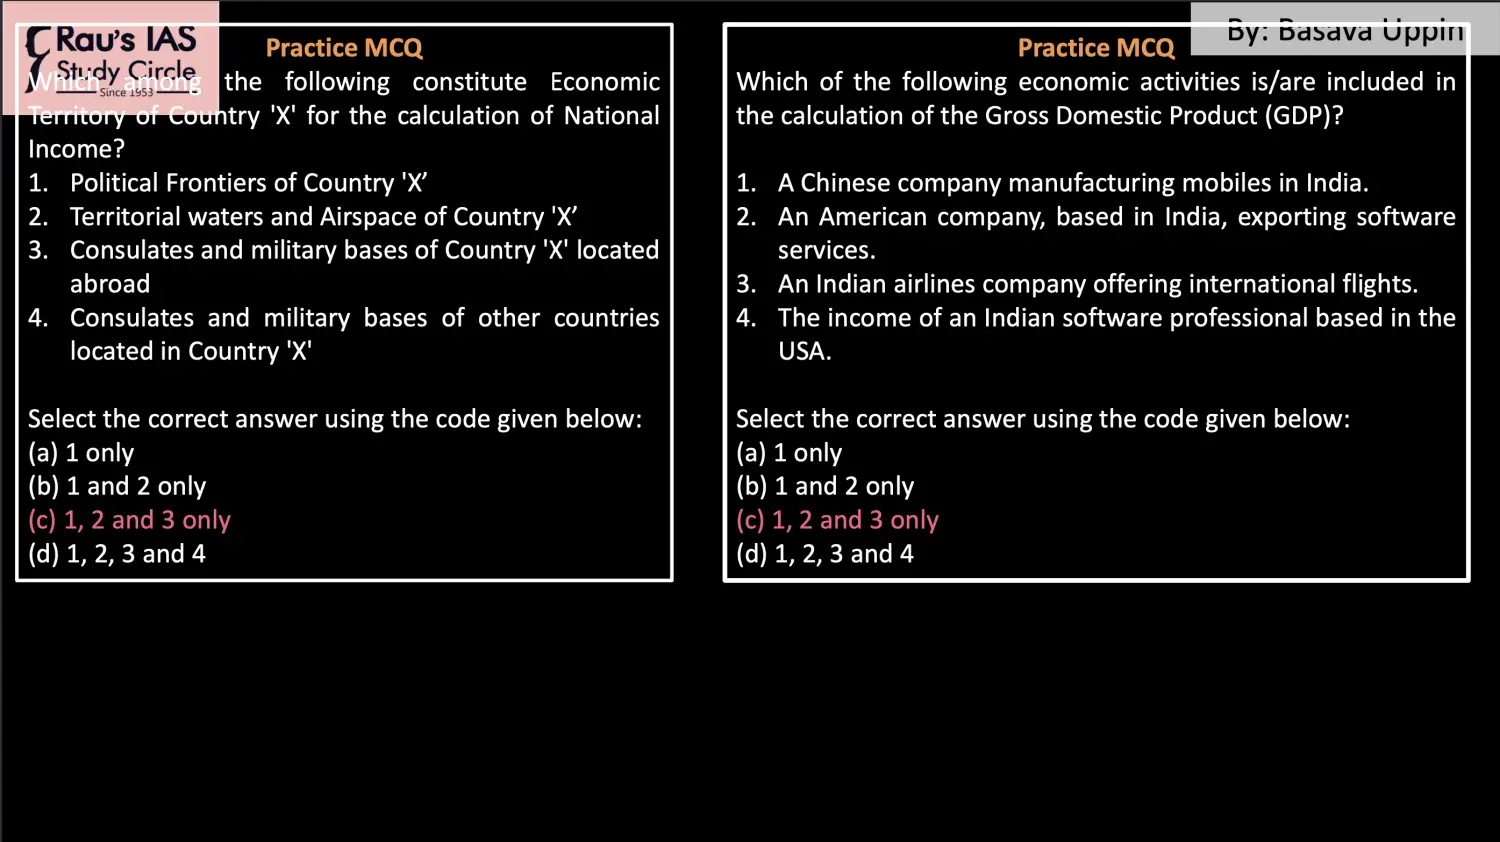
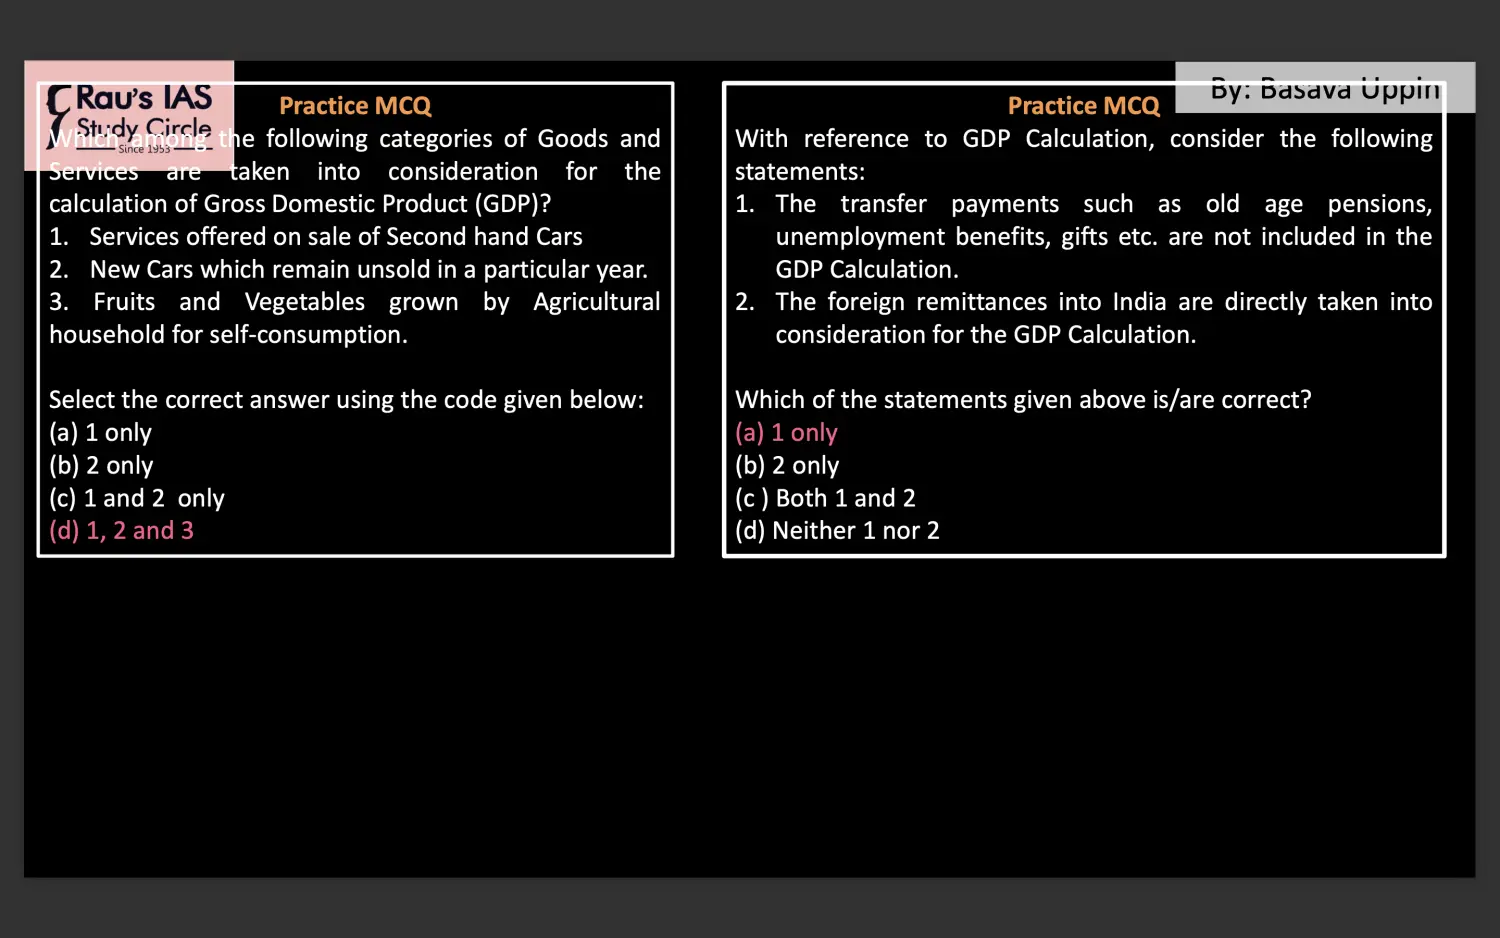
Foreign Remittance is not considered directly but by means of Private Final Consumption Expenditure
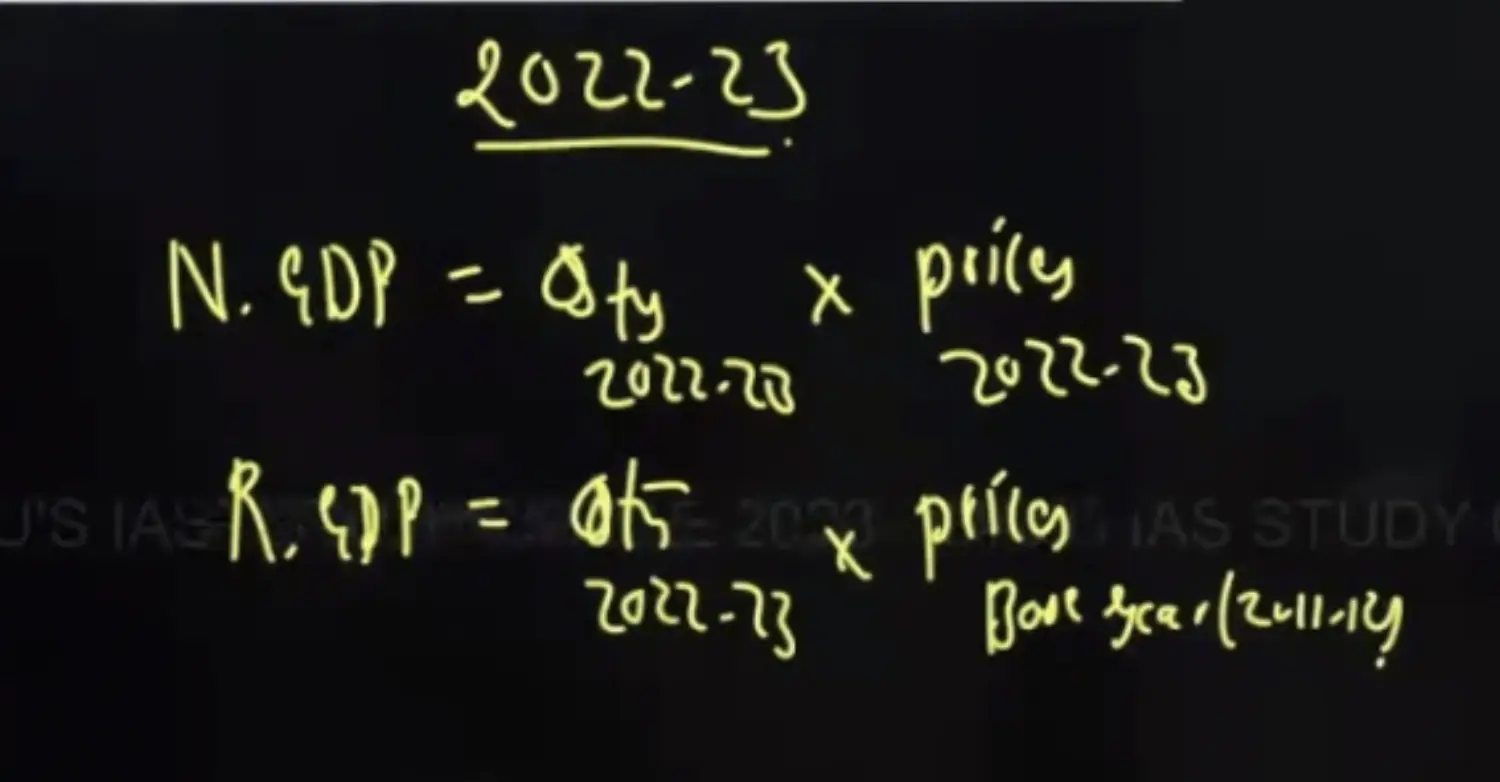
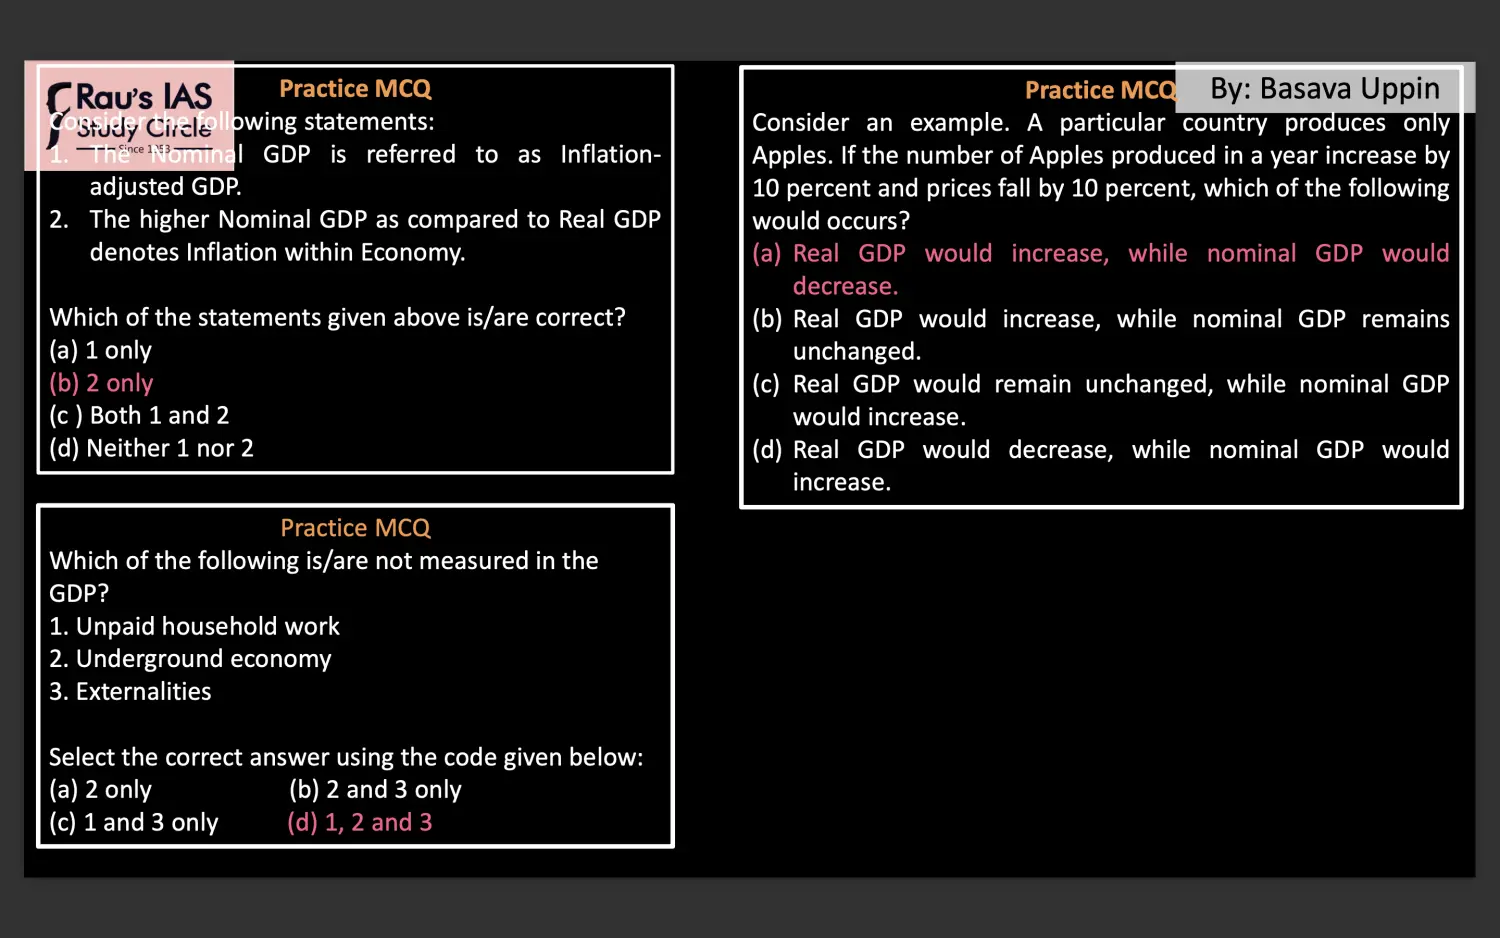
Real GDP is calculated at Base Year Price. Real GDP is called as Inflation adjusted GDP
Nominal GDP is the current year's GDP
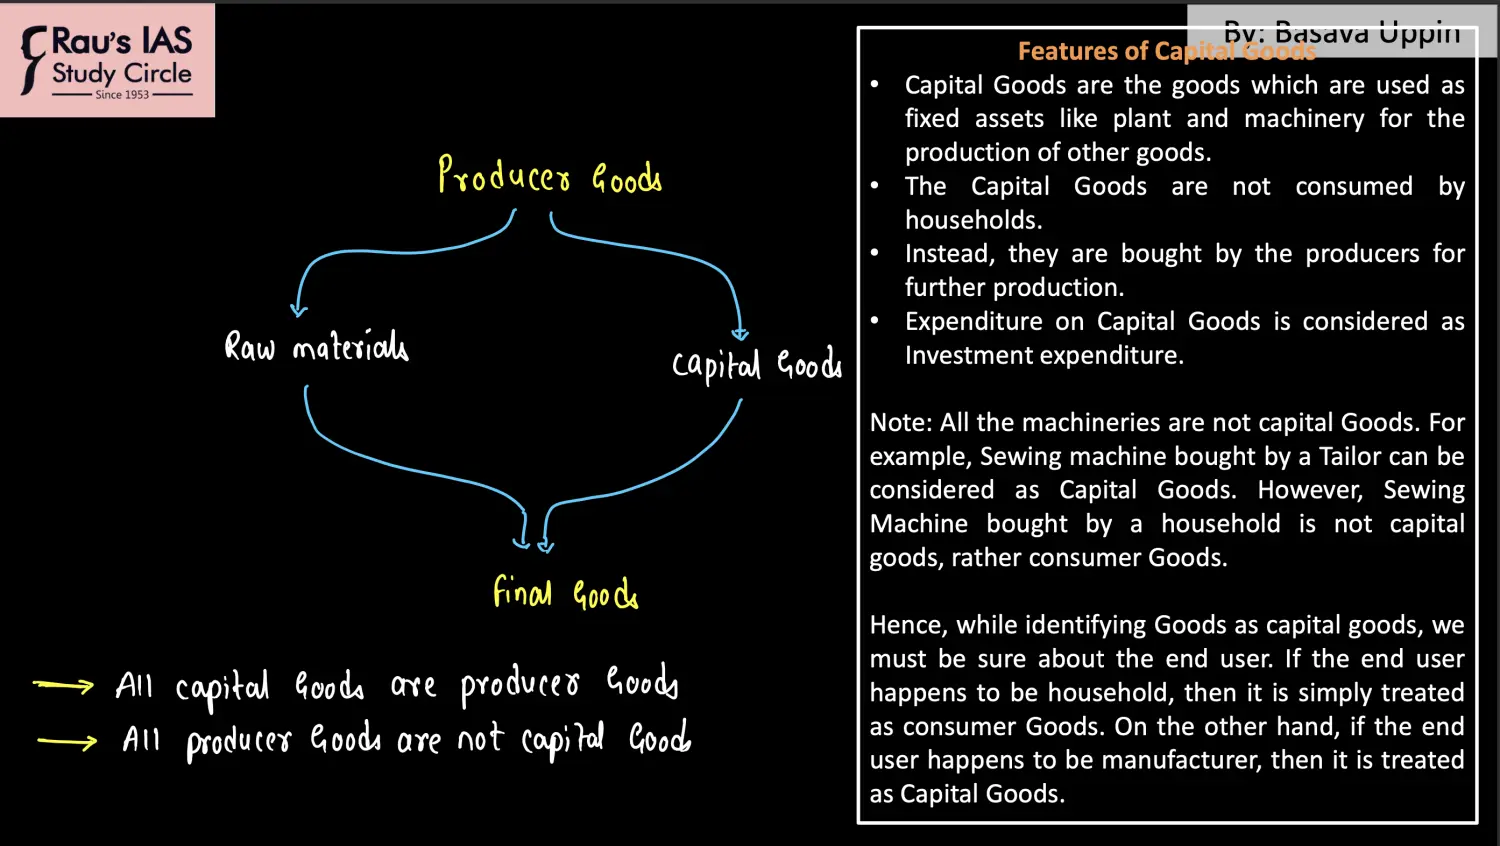
Whenever we say that Indian GDP is Increasing or Decreasing, we talk about Producer Goods
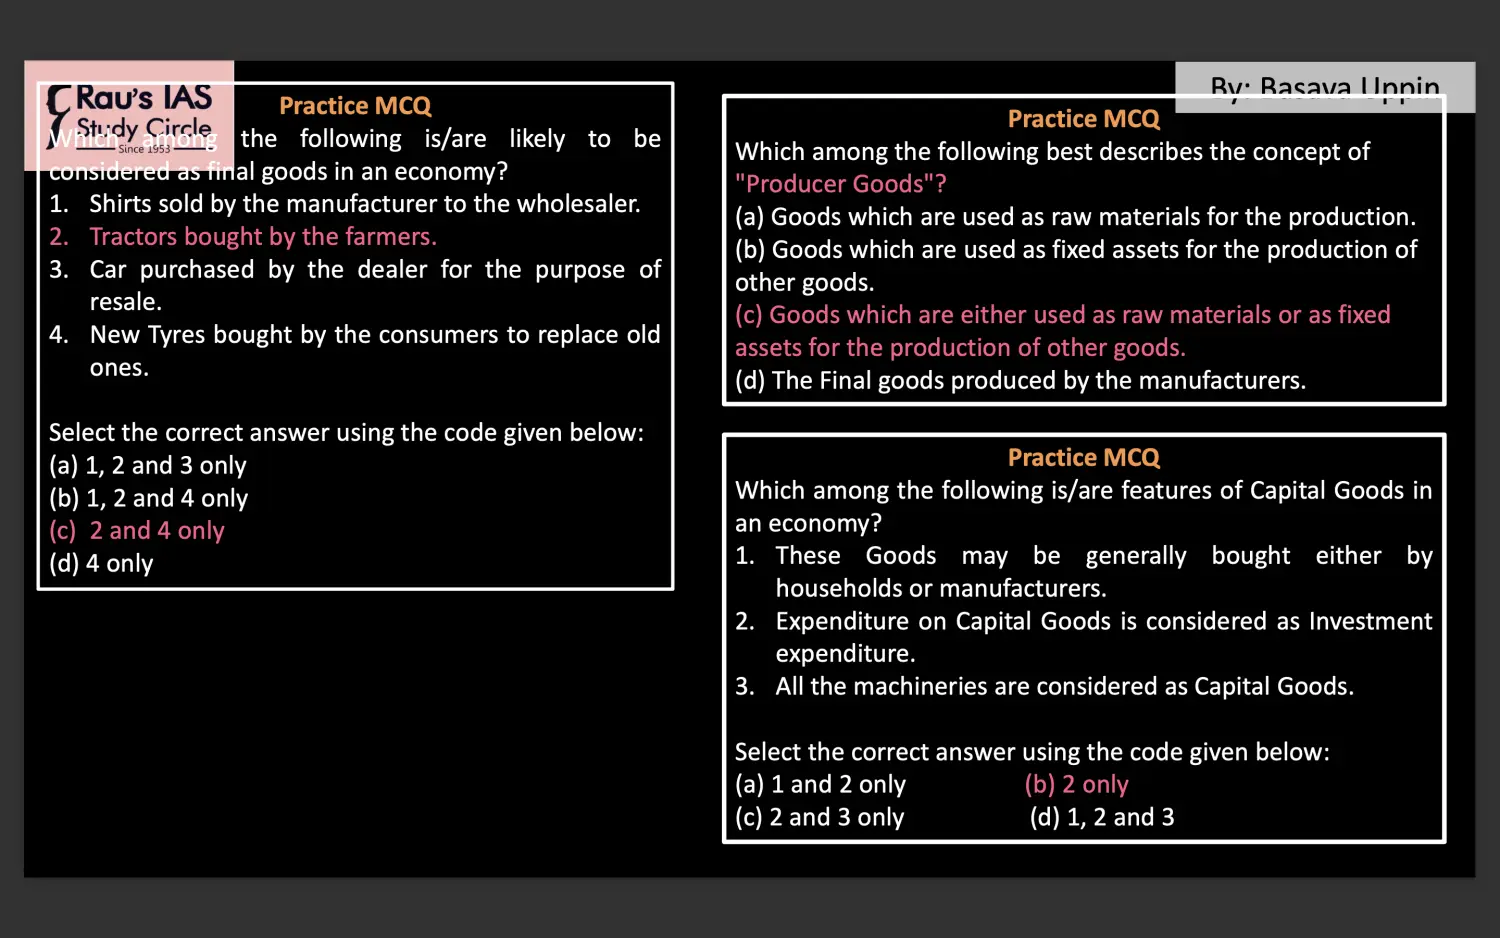
Producer Goods (Raw Material + Capital Goods) && Final Good
Concept of Factor Cost, Basic Price, Market Price
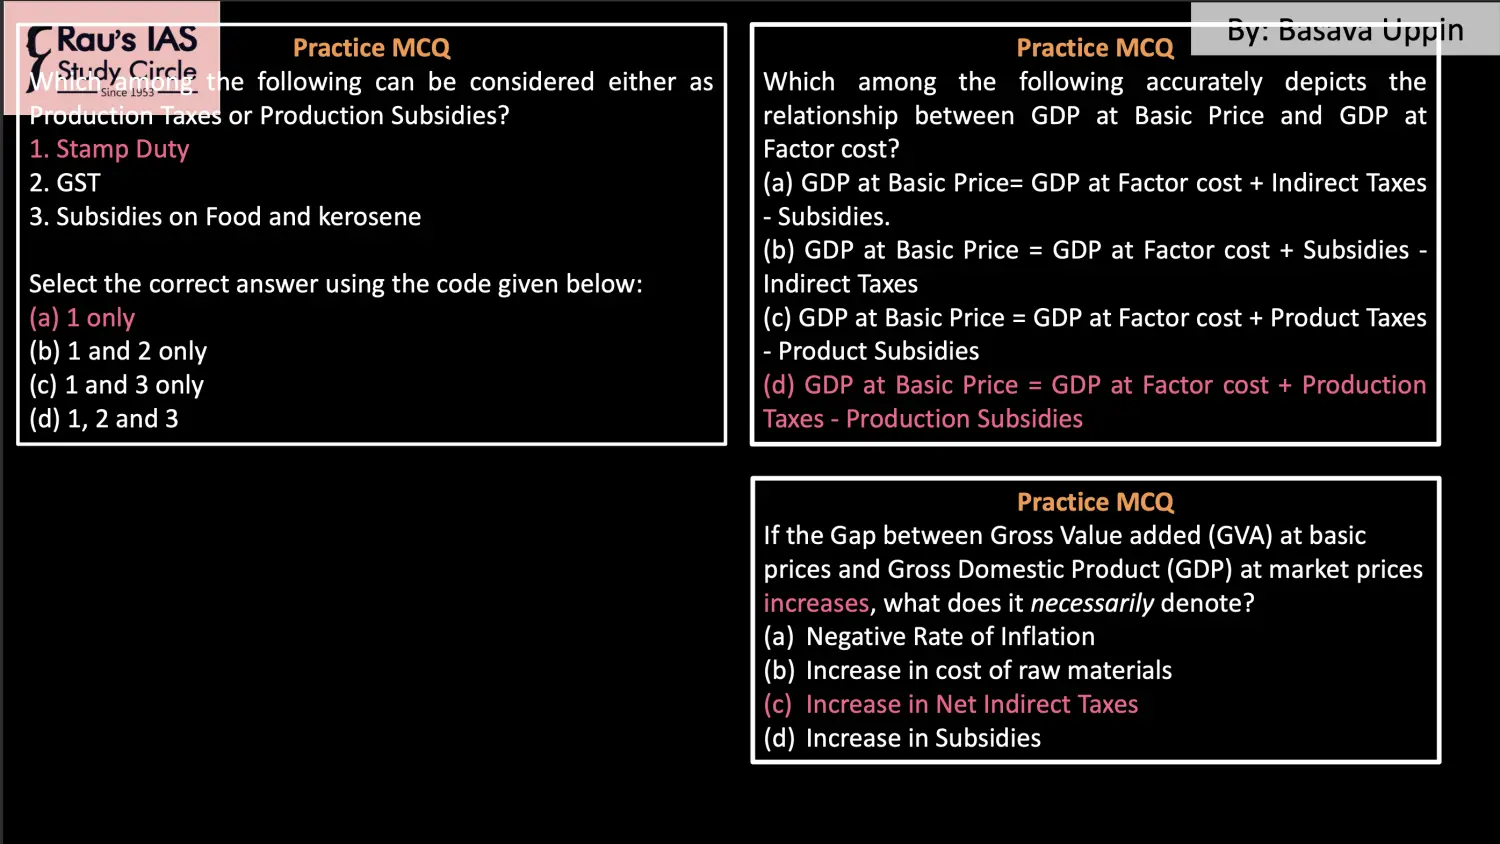
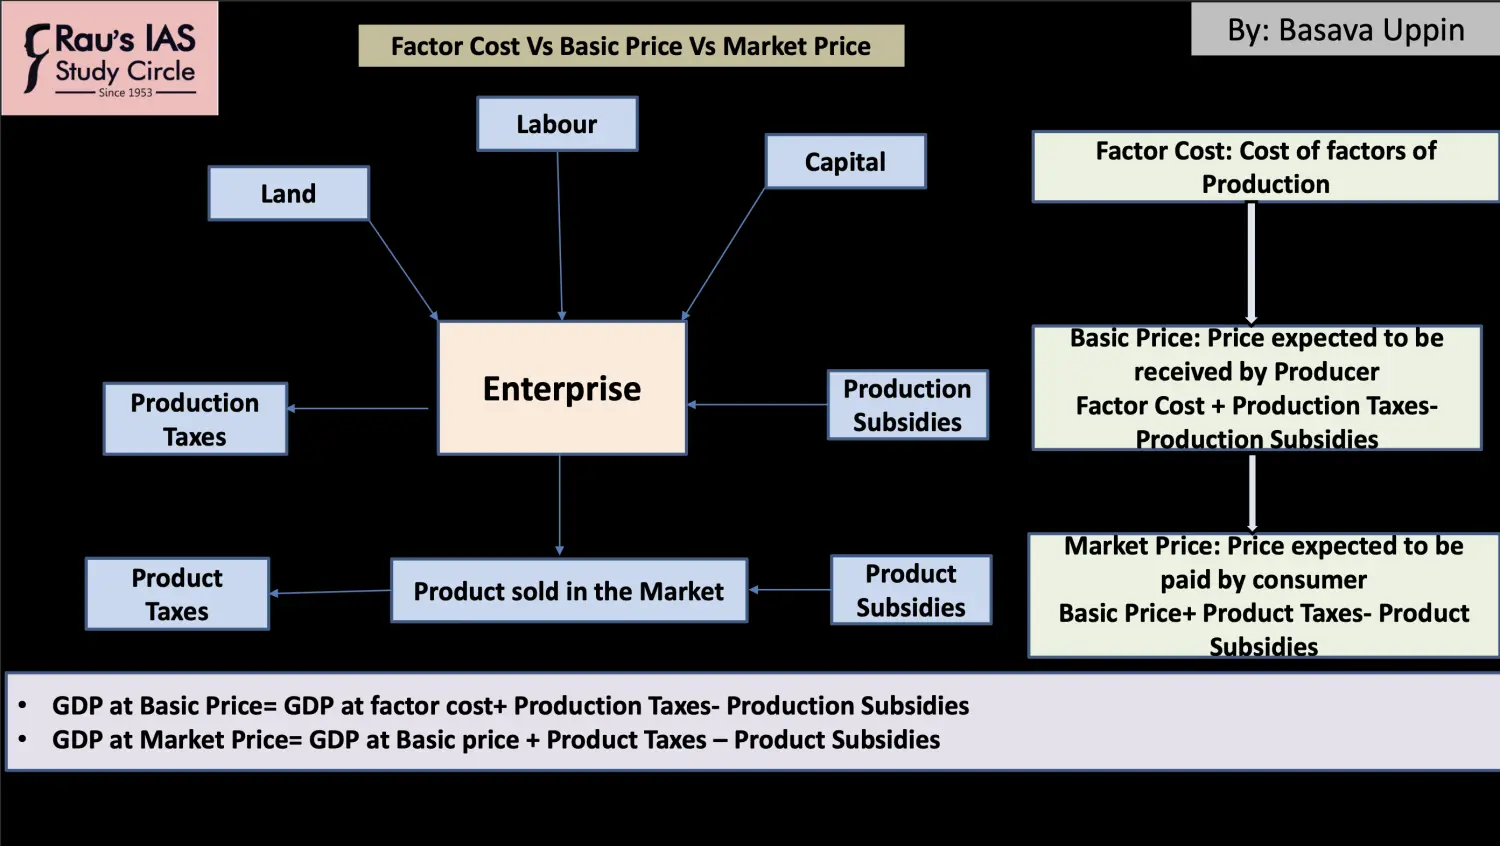 💵 GDP + Tax - Subsidy
Net Indirect Taxes = Tax - Subsidies
GDP at
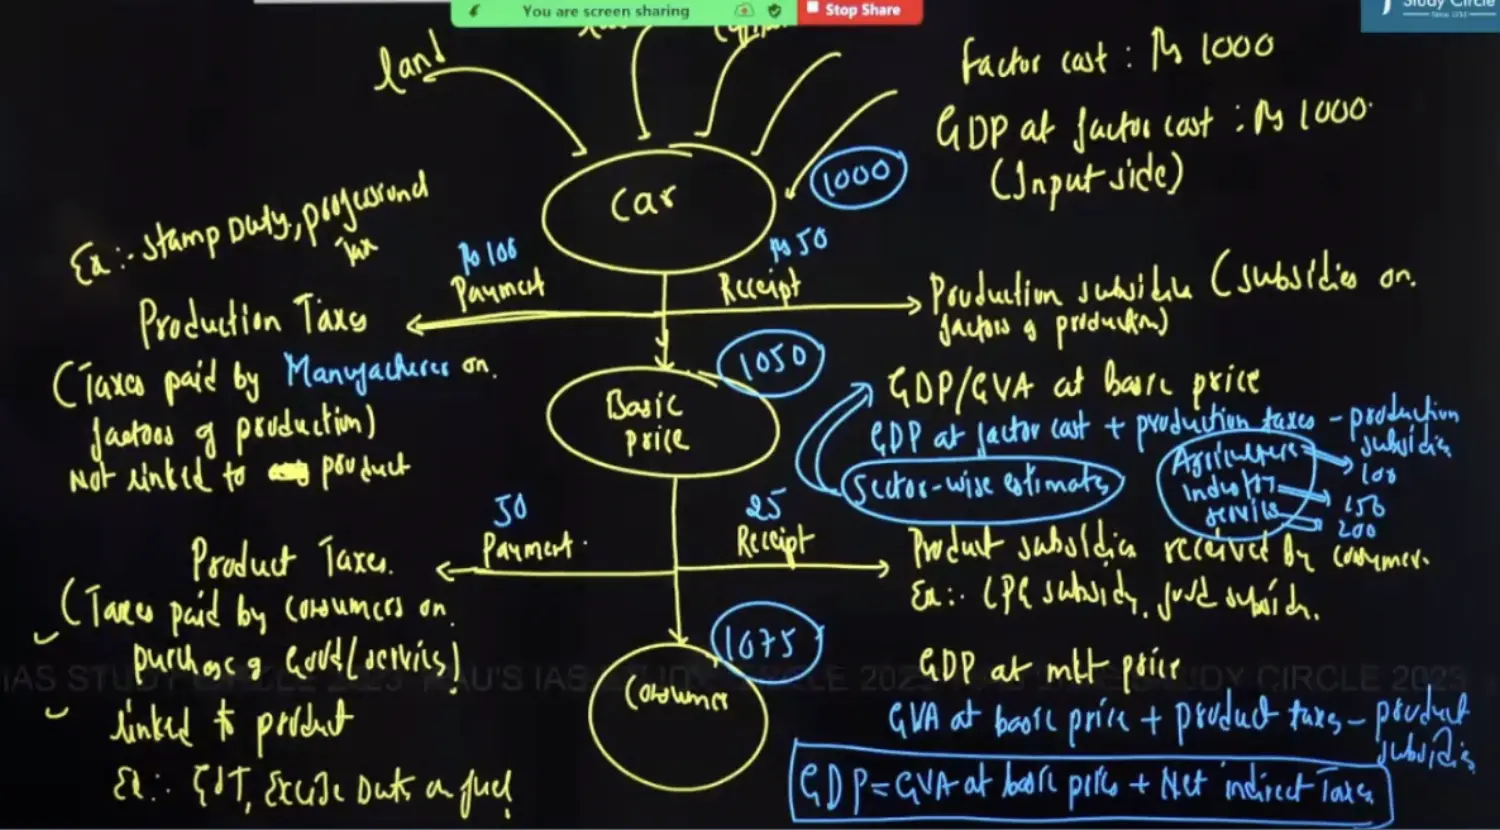
- GDP at Factor Cost - Rs 1000
- GDP at Basic Price - 1050
- GDP at Market Price - 1075
Sector Wise GDP is calculated by Summation of GVA at Basic Price of difference Sectors
Hence, GDP = GVA at Base Price + Net Indirect Tax
GDP = GVA at Base Price + Product Taxes - Product Subsidies
Here, Taxes >>> Subsidies
Hence, GDP >>>> GVA
Scenario 1
- Decline in Product Taxes : Difference between GDP & GVA will decrease
- Increase in Product Taxes : Difference between GDP & GVA will Increase
Practise Question
Calculation of GDP by Expenditure Method
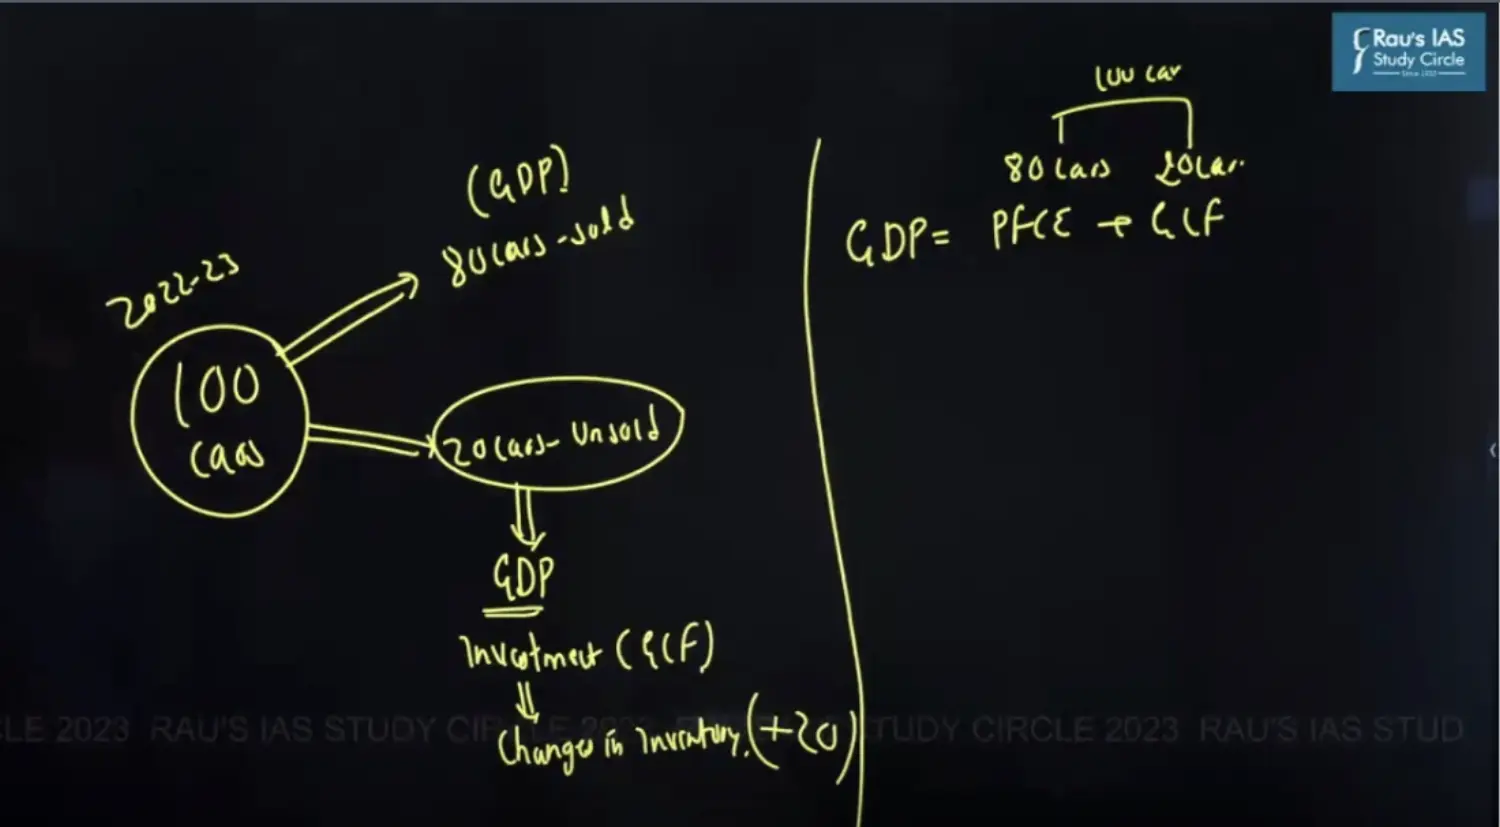
GDP by Expenditure = PFCE + GFCE + GCF + (X_M)
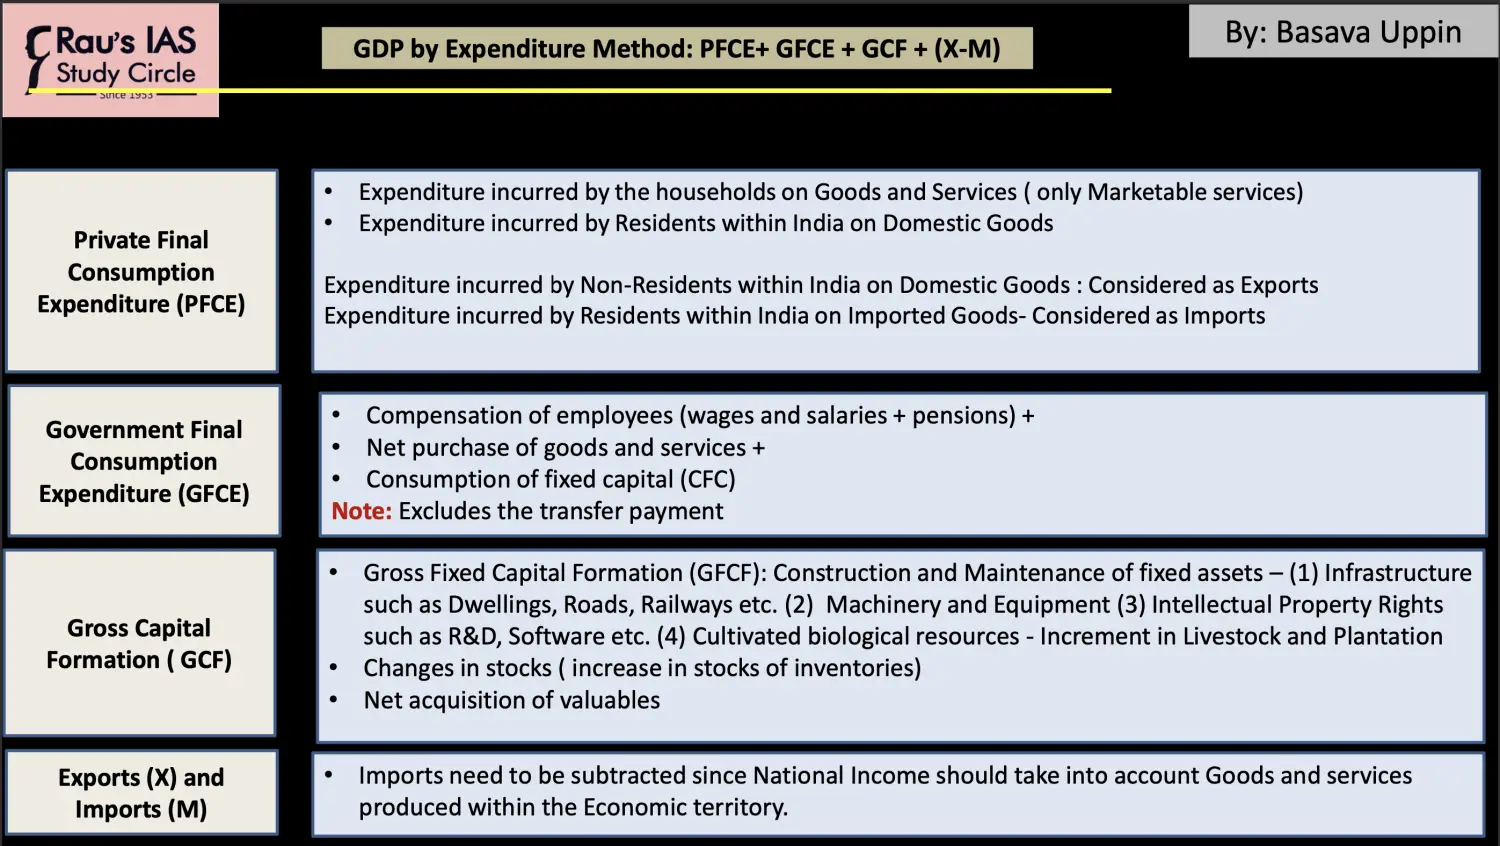
PFCE
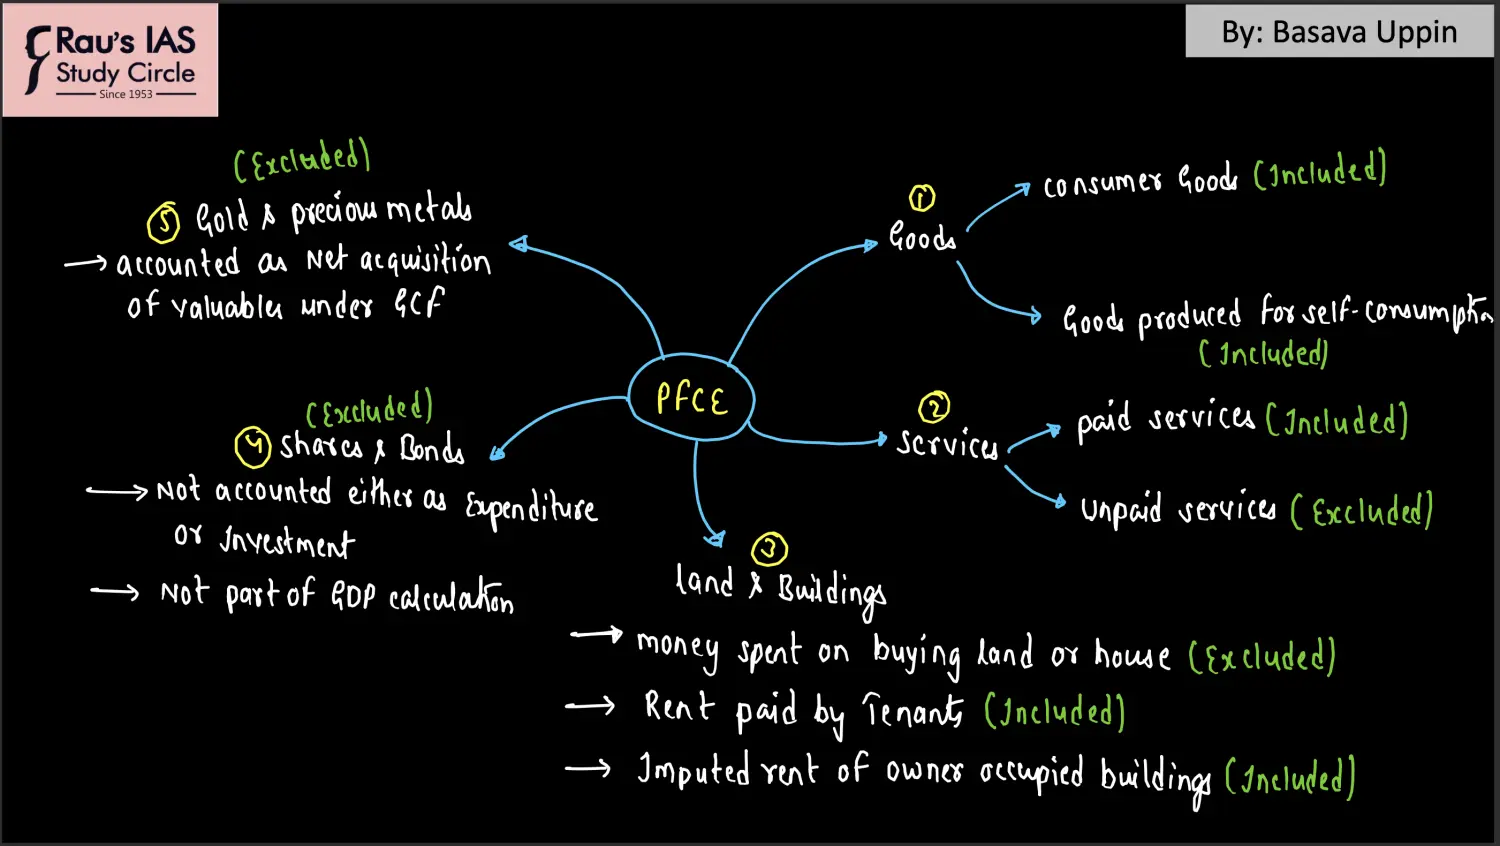
Trading : Not Included ; Giving Service or Paying Rent : Included ;
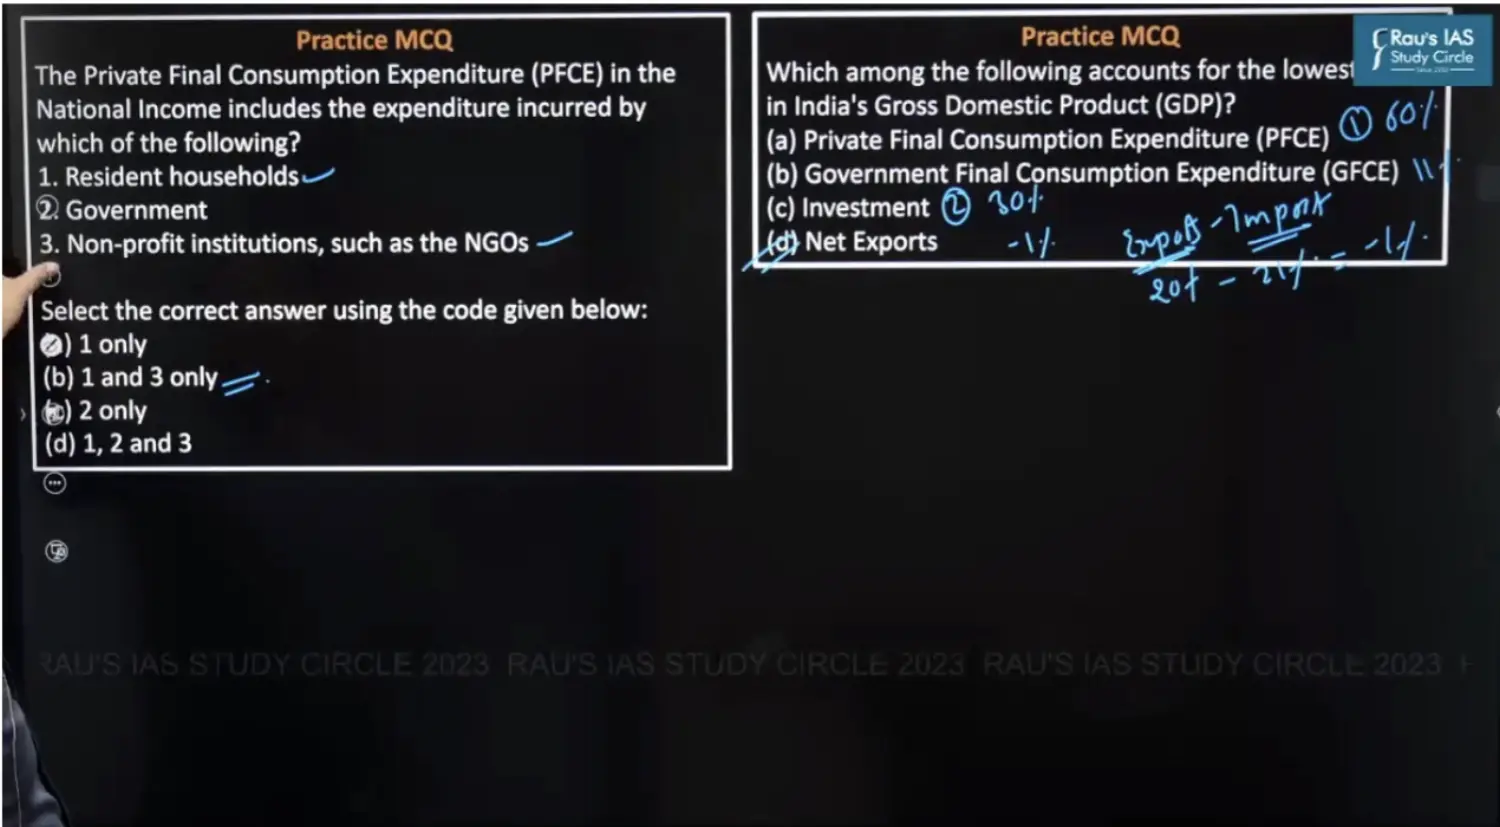
GFCE

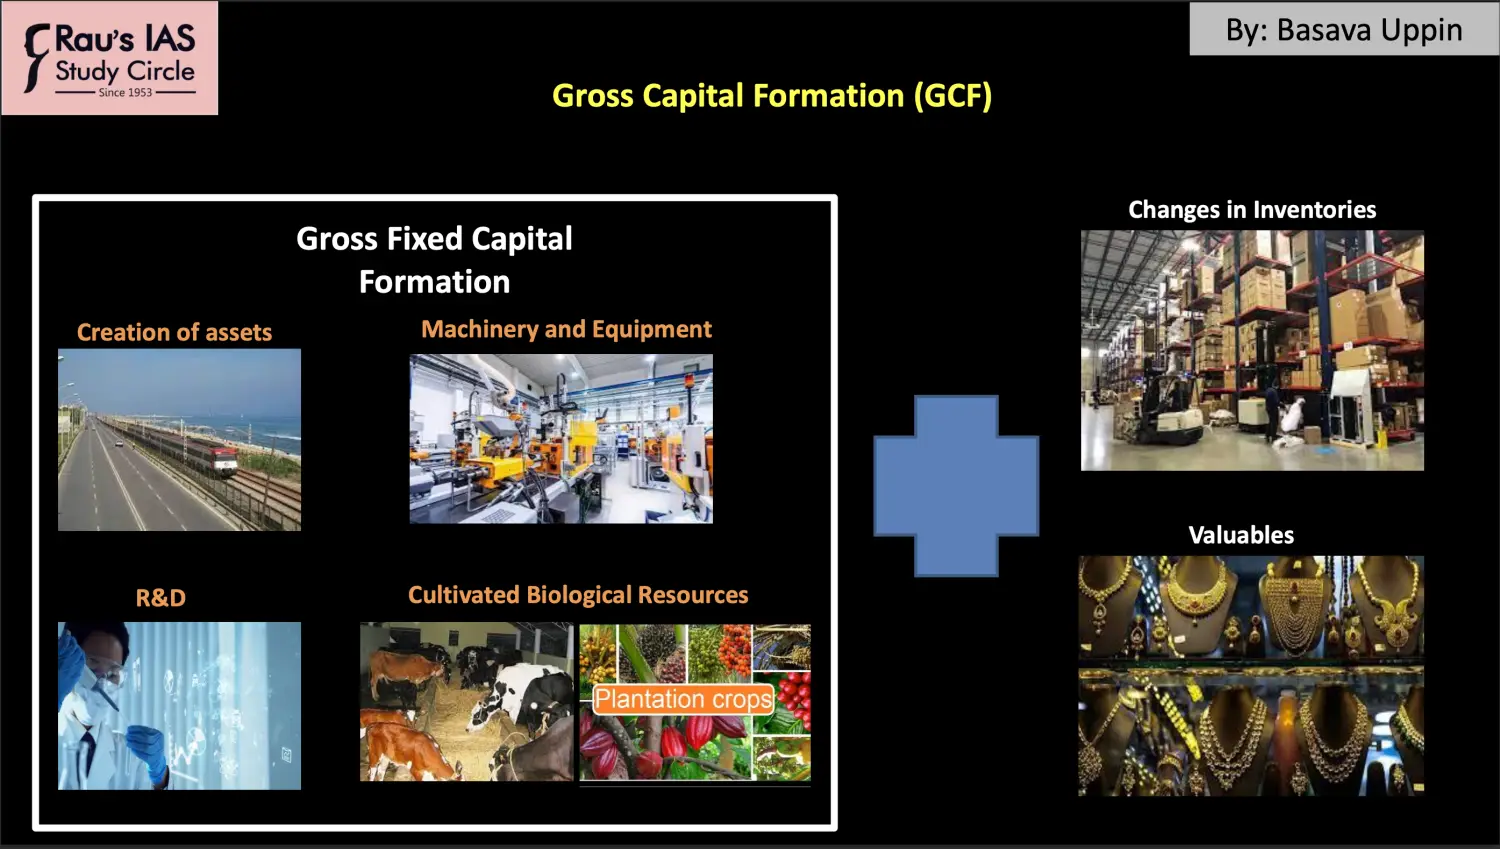
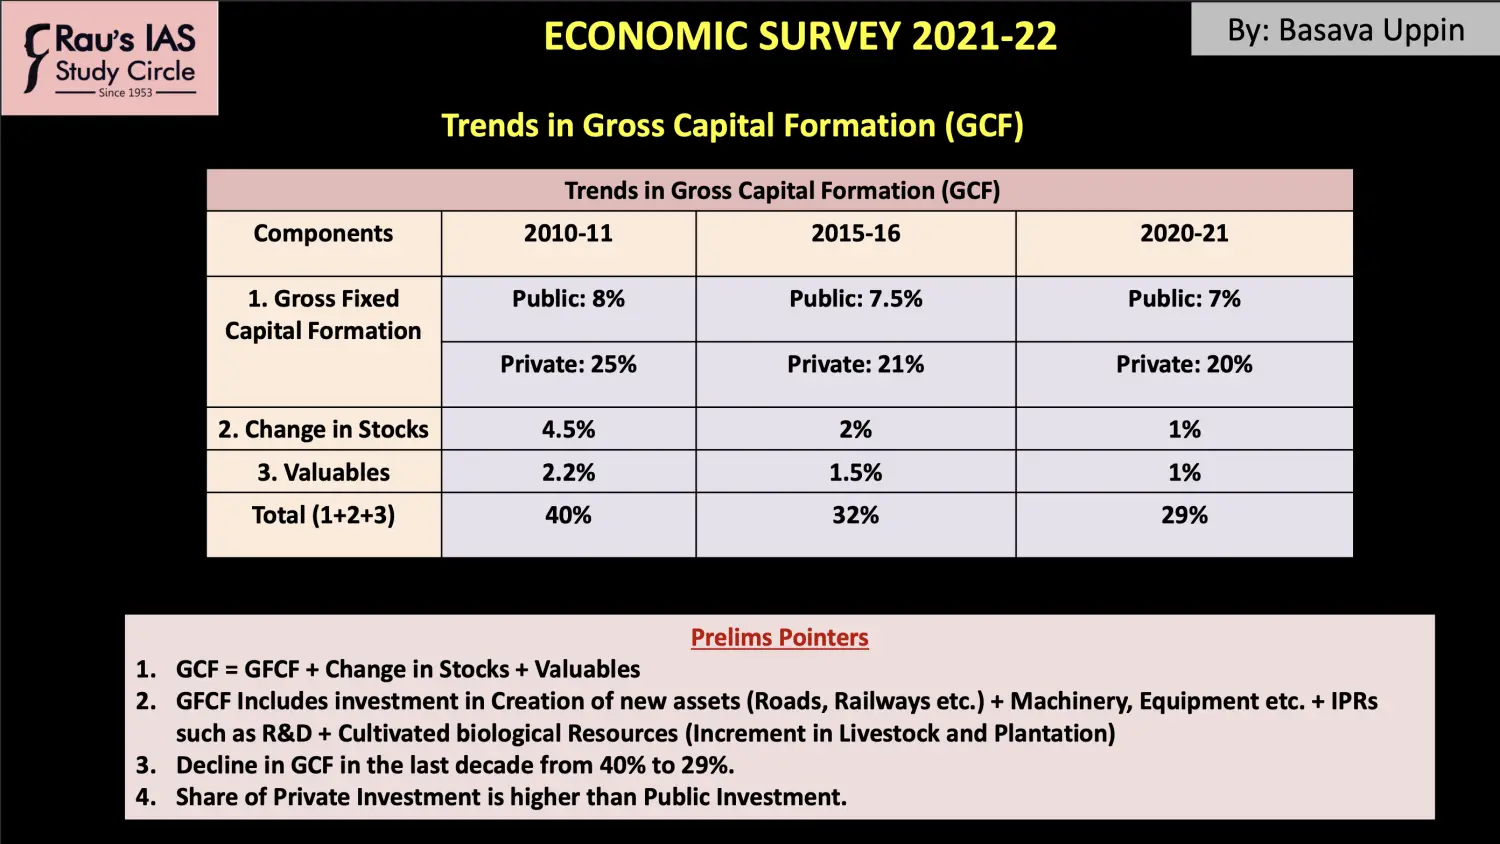
GCF (Investment or Gross Investment)
GCF = GFCF + Change in INventory + Valuables
Net Exports

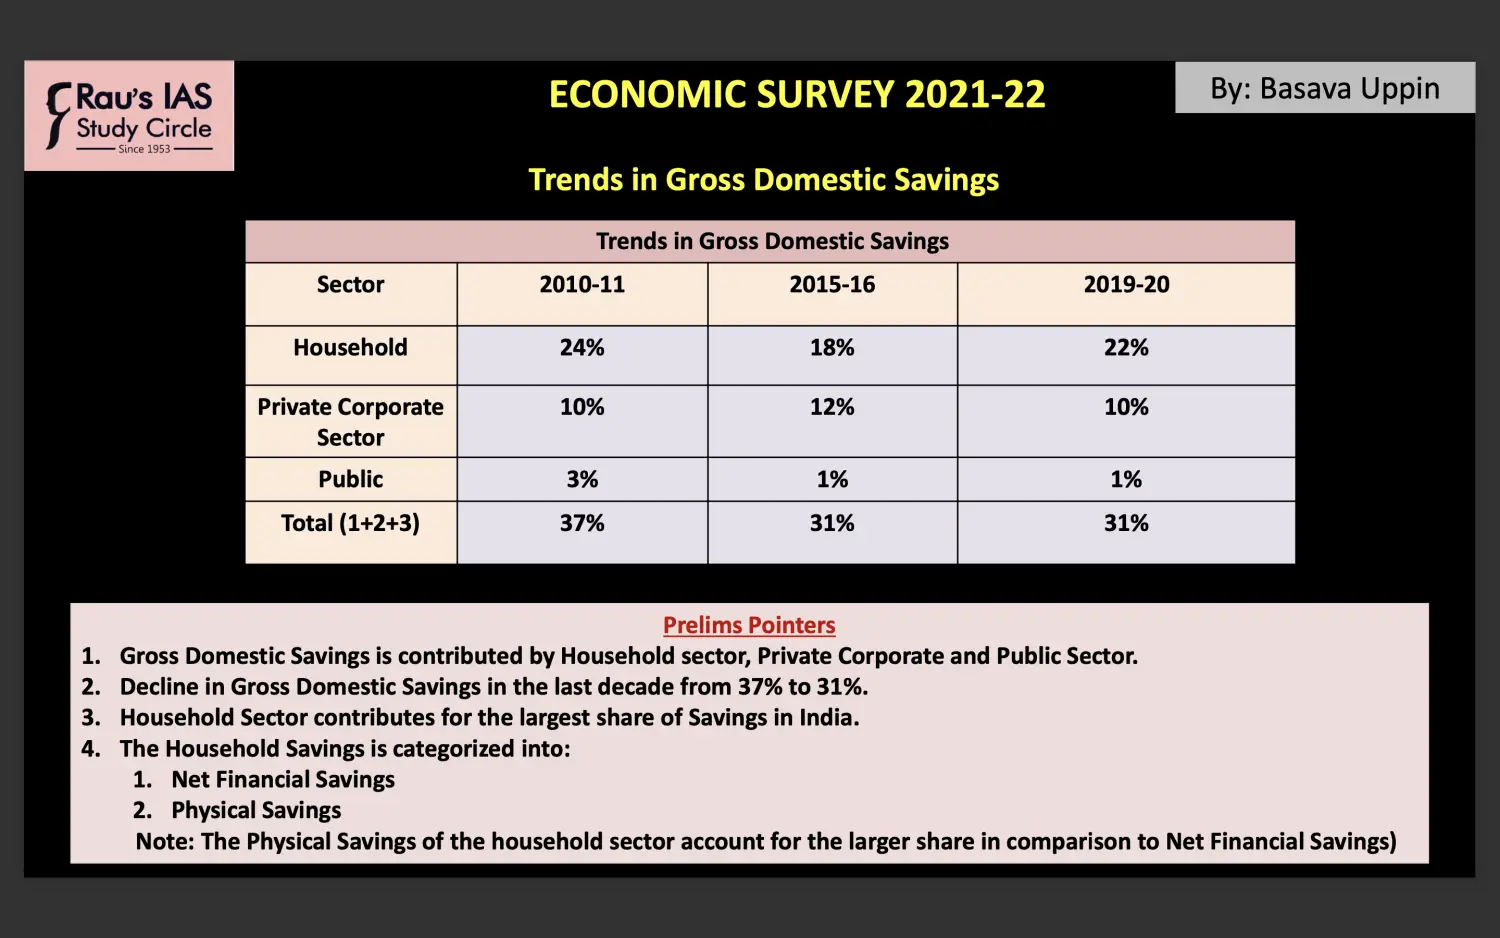
Trends in Gross Domestic Saving
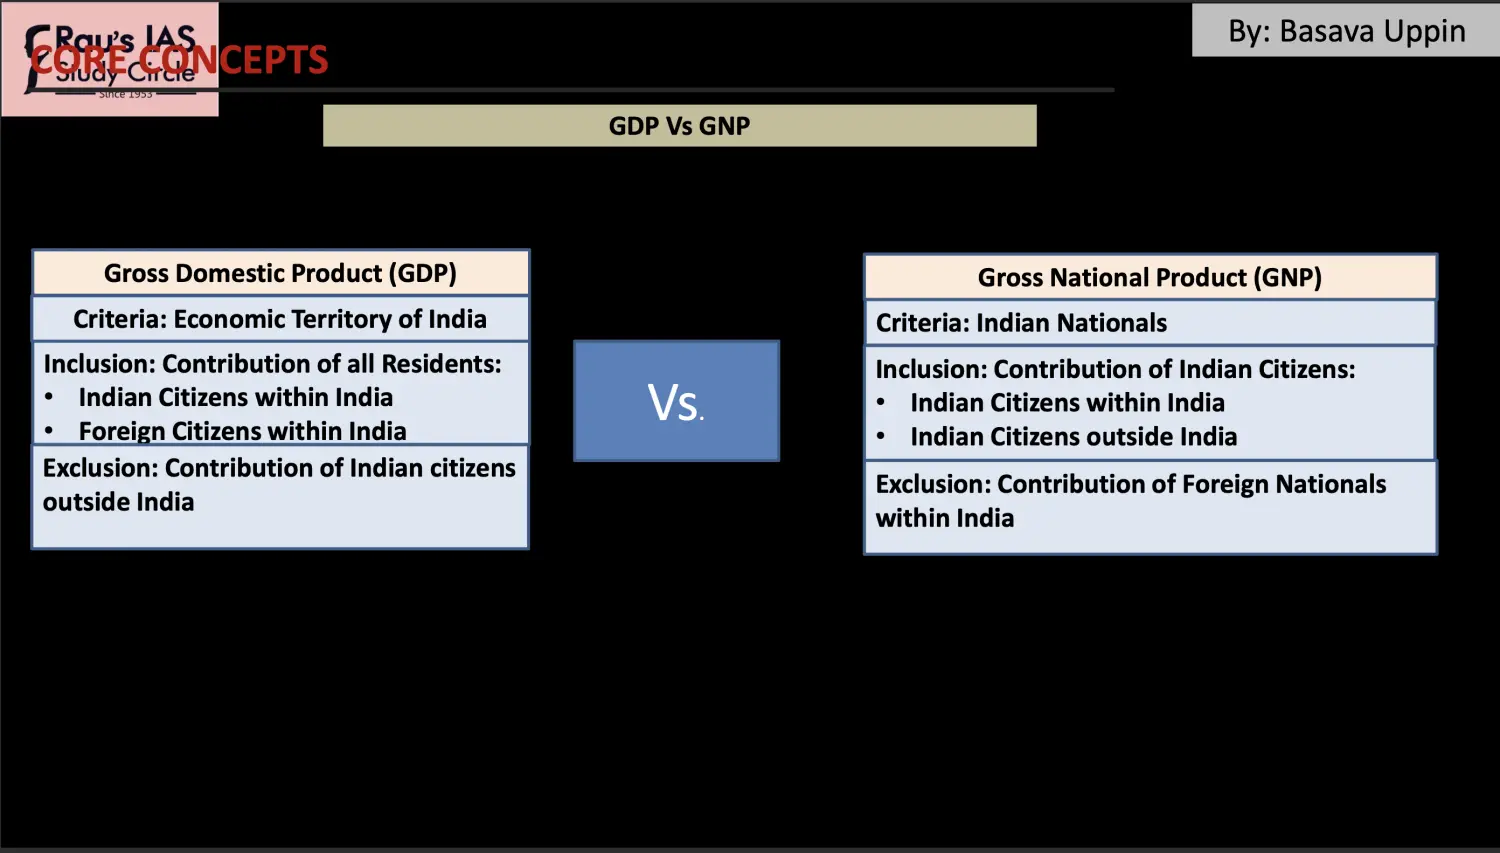
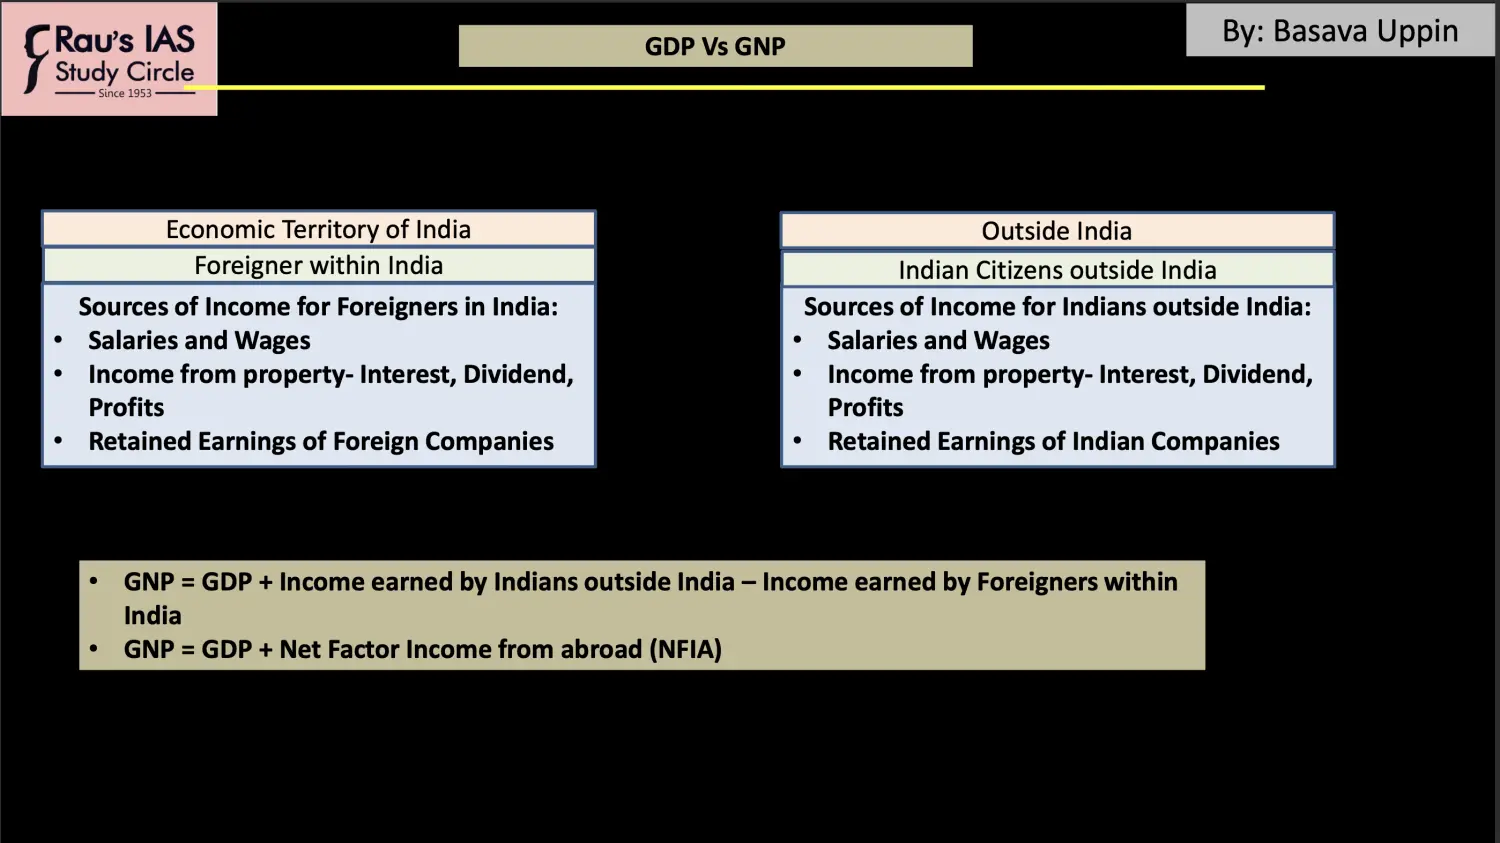
GDP v/s GNP
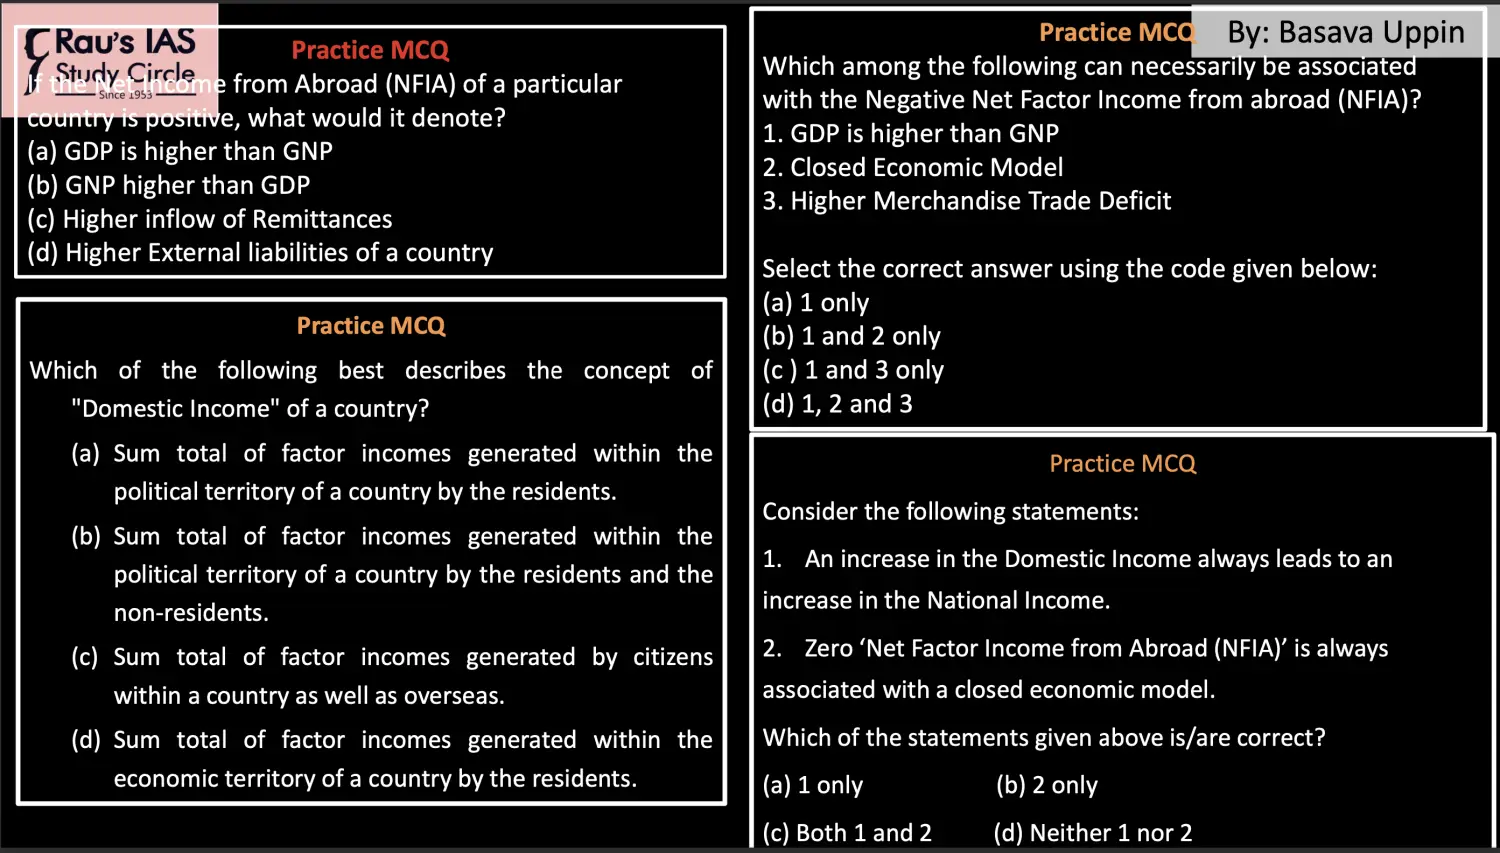
Practise MCQ
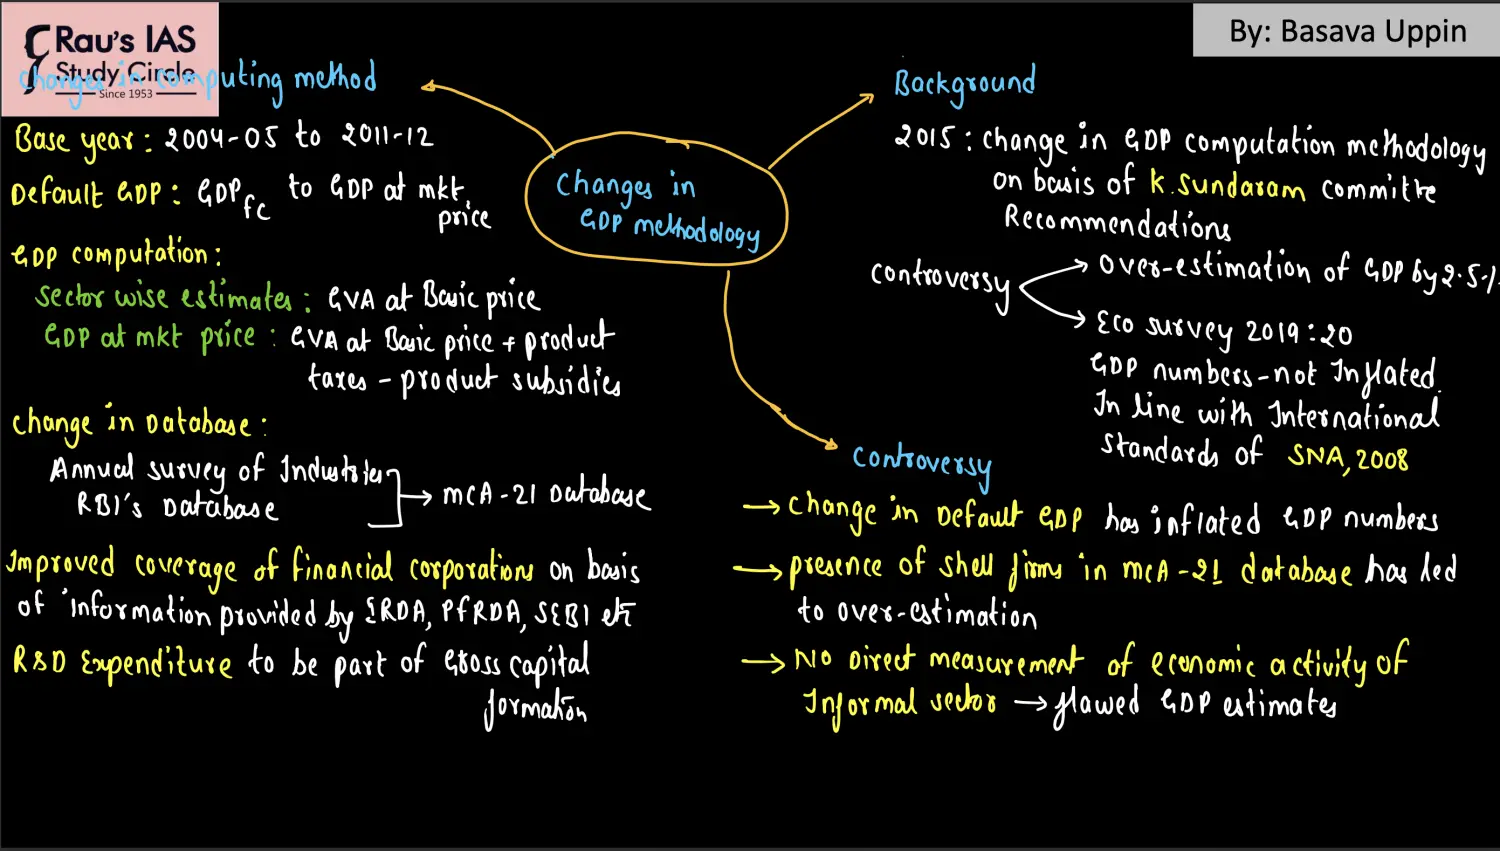
Change in GDP Calculation Methodology
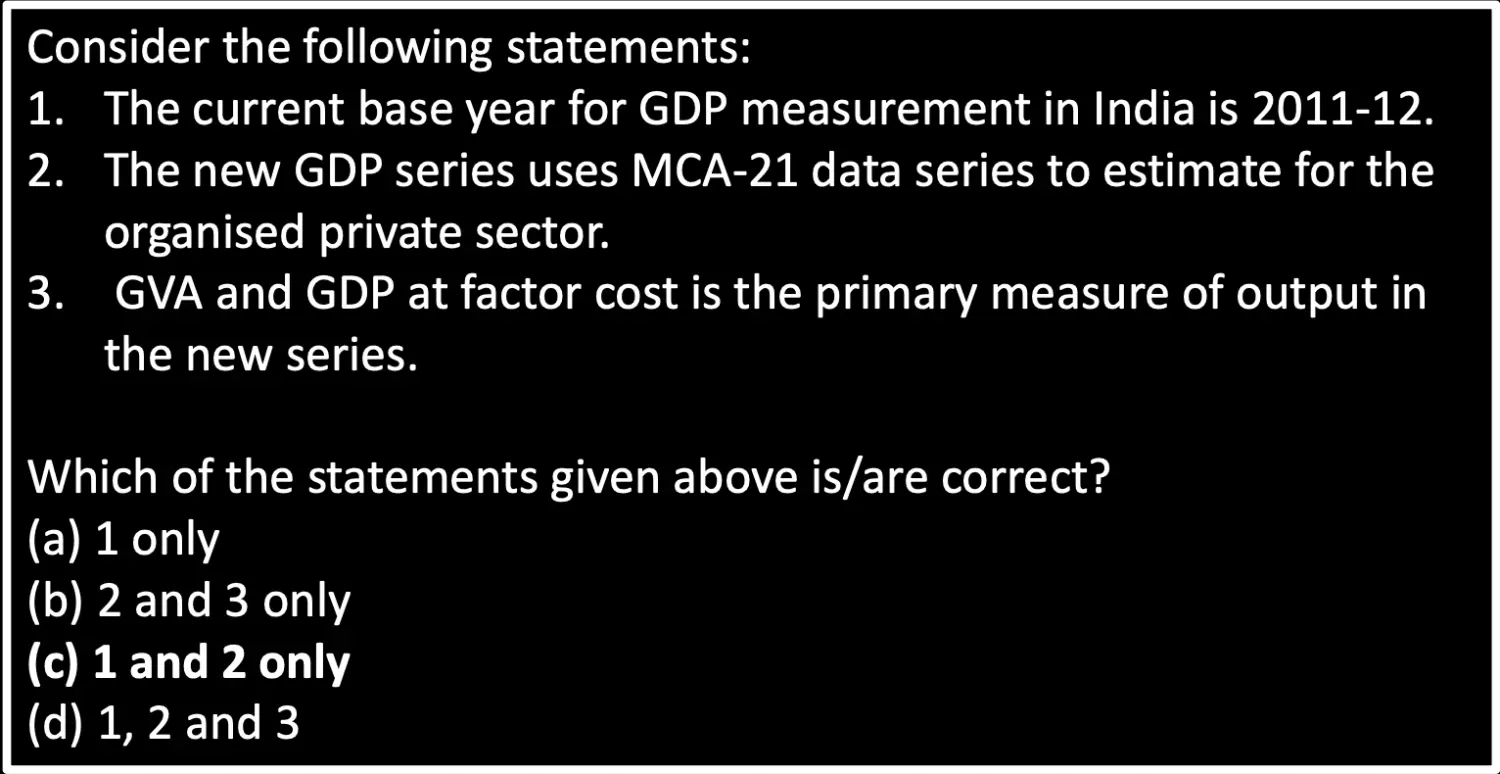
Practise MCQ
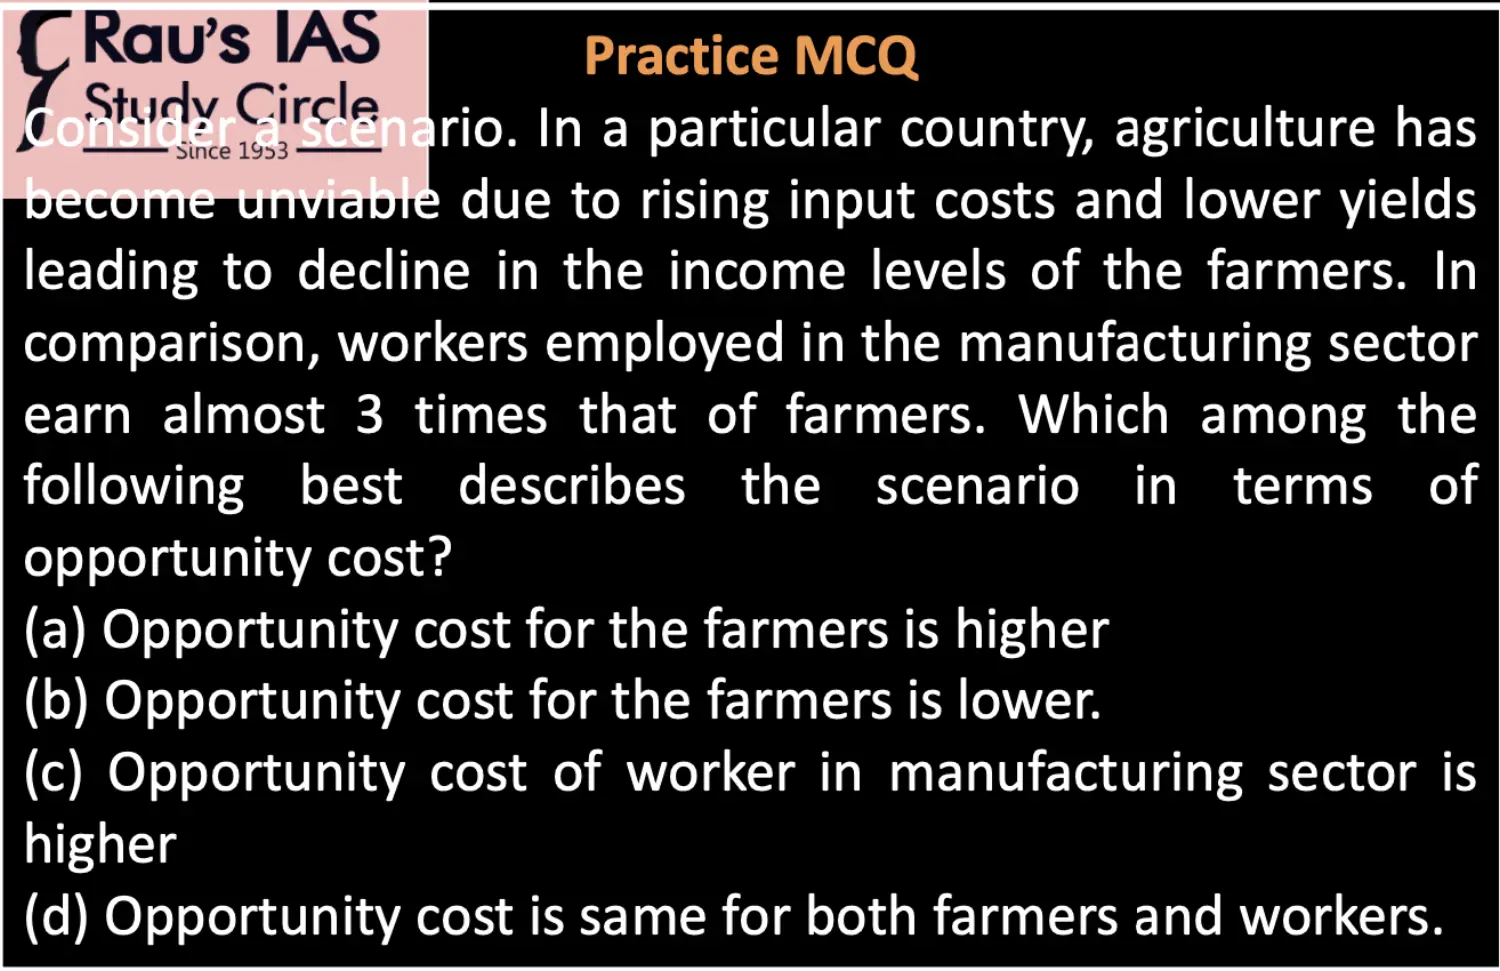
Types of Goods
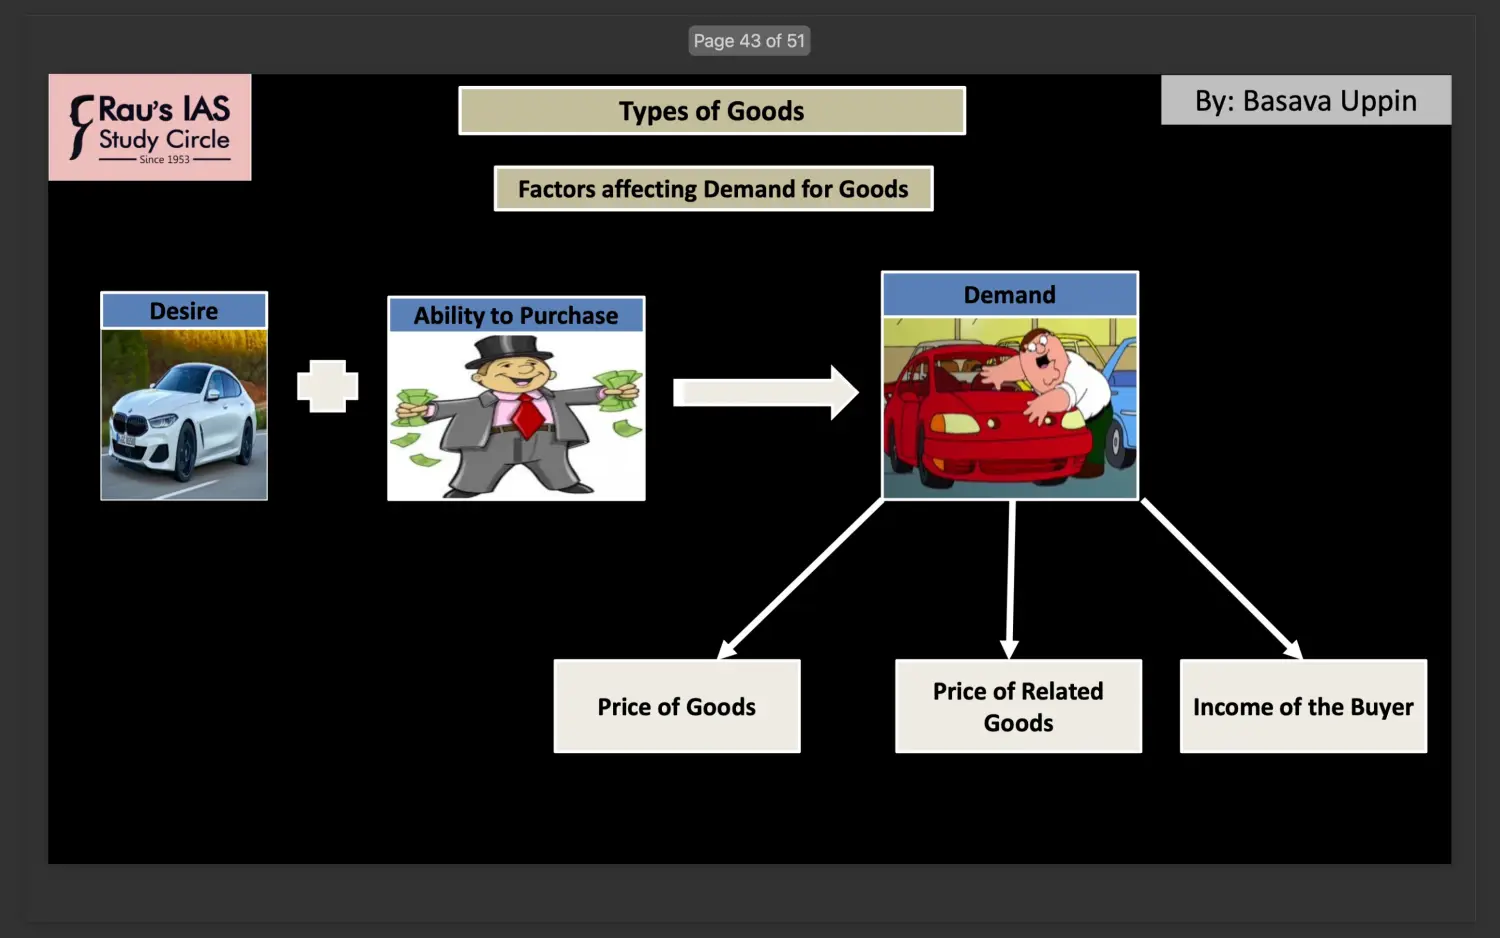
Types of Goods
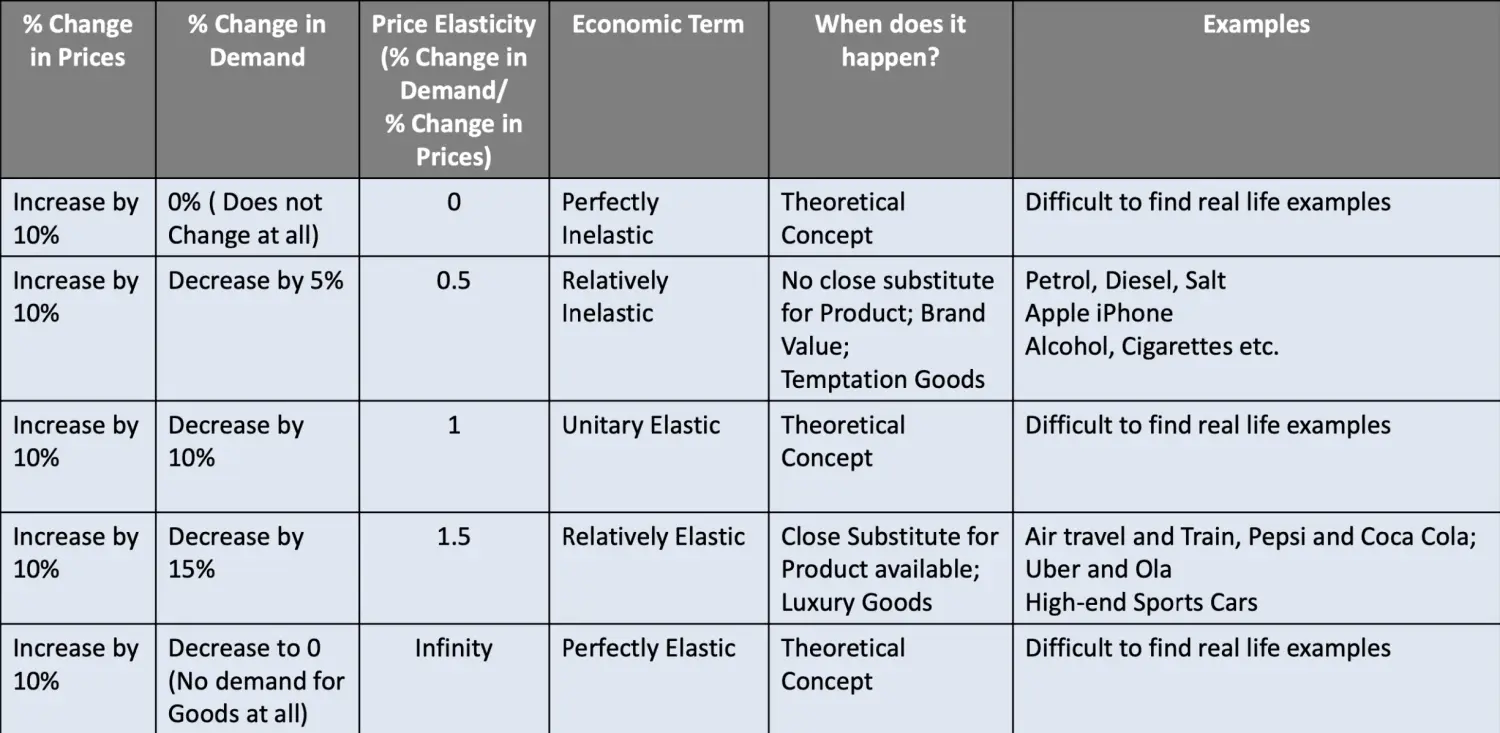
Price Elasticity
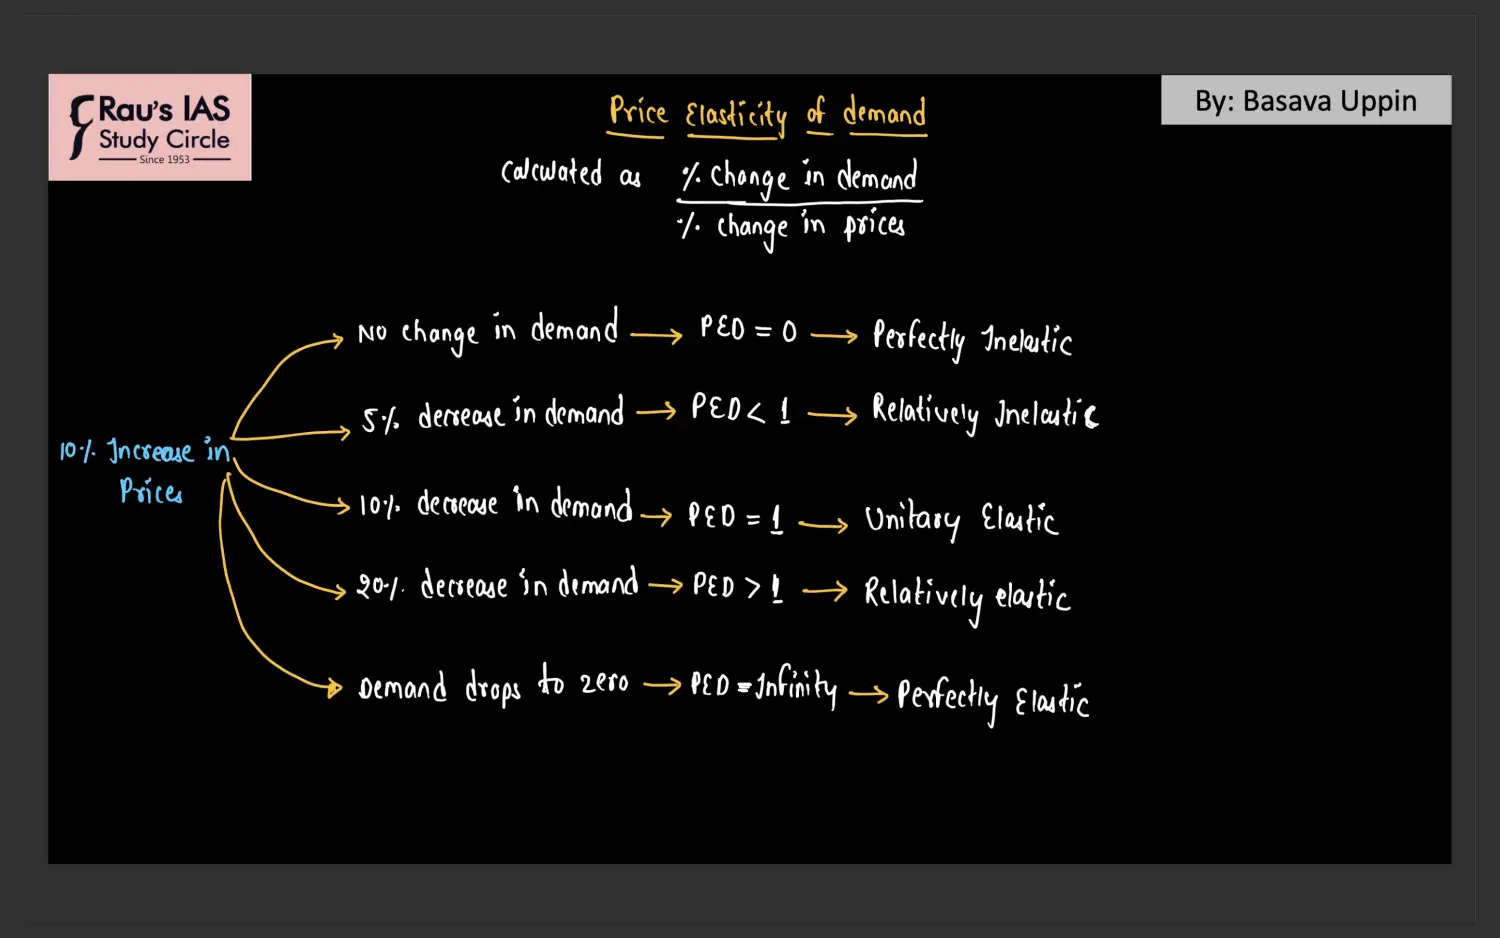
How Changes in Price impact the Demand
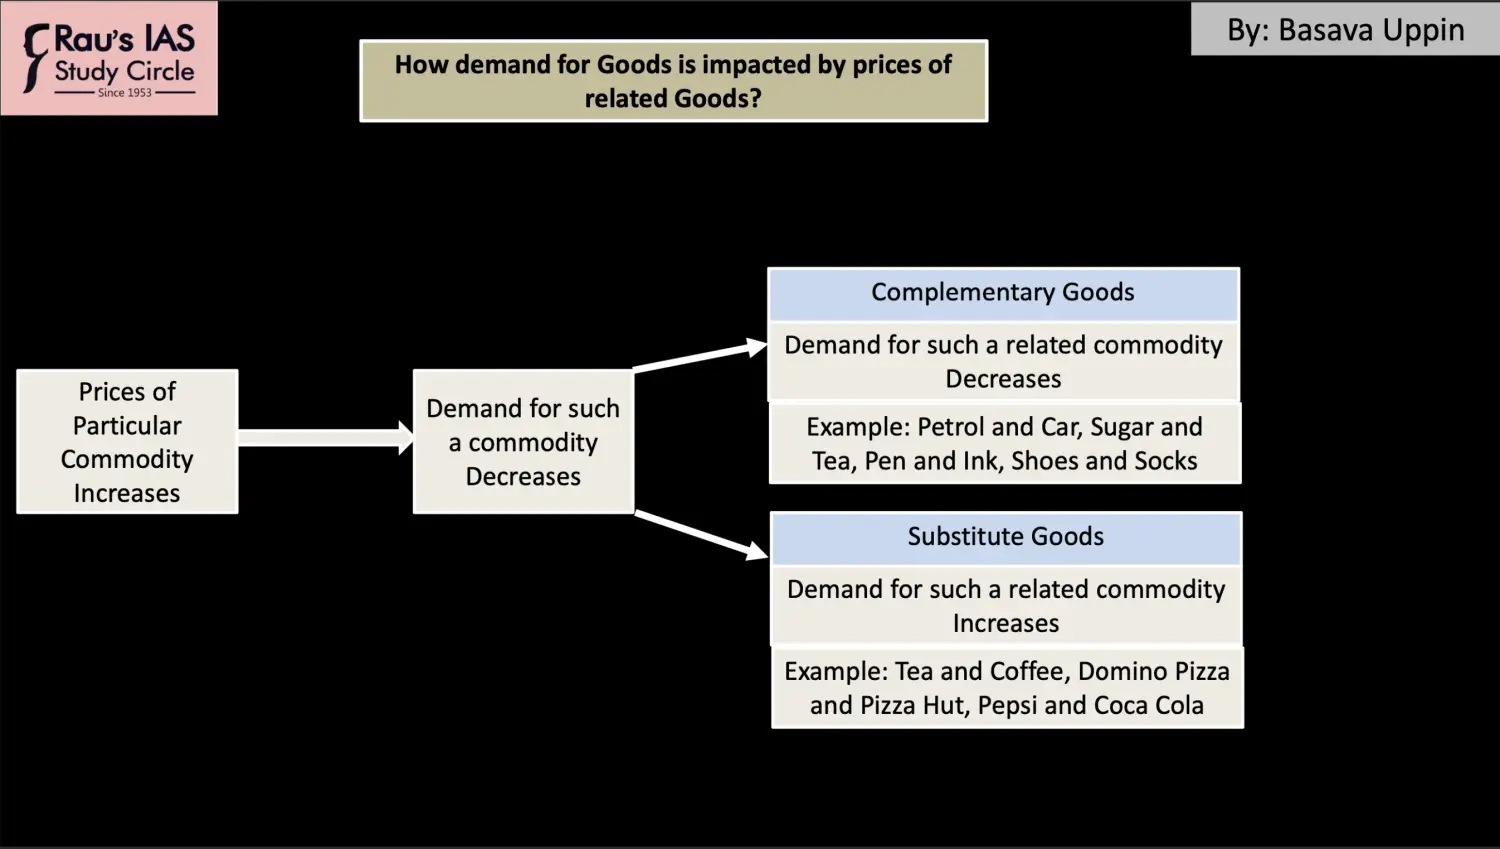
How Demand for goods impact by prices of Goods
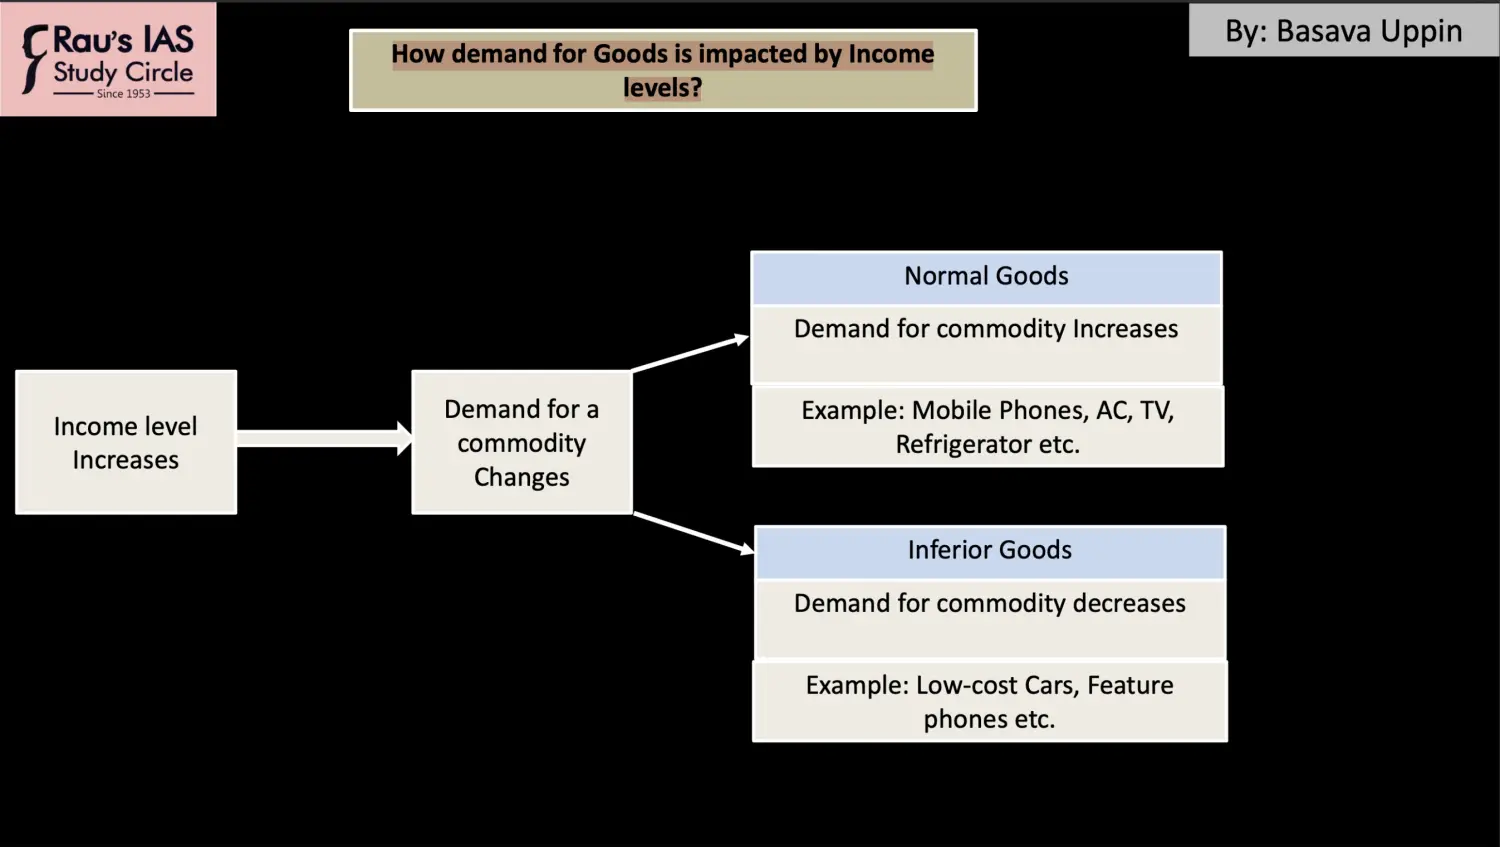
How demand for Goods is impacted by Income Levels
Exception to Law of Demand