Chapter 07 - Inflation
Prelims Syllabus
Introduction
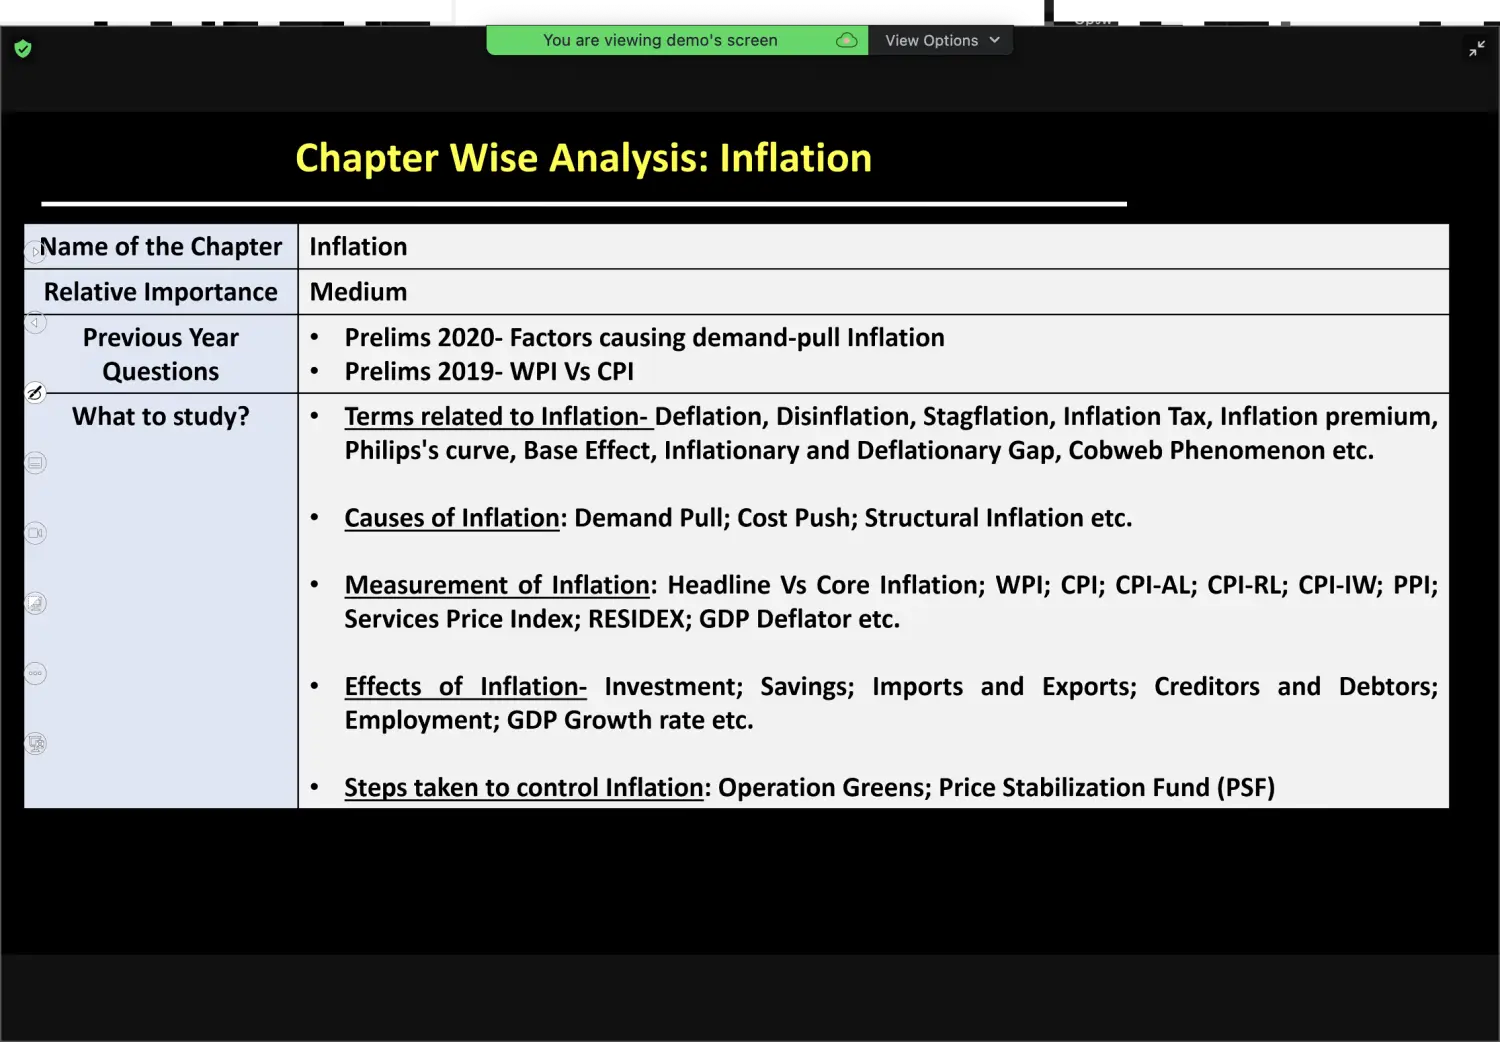
PYQP Sample
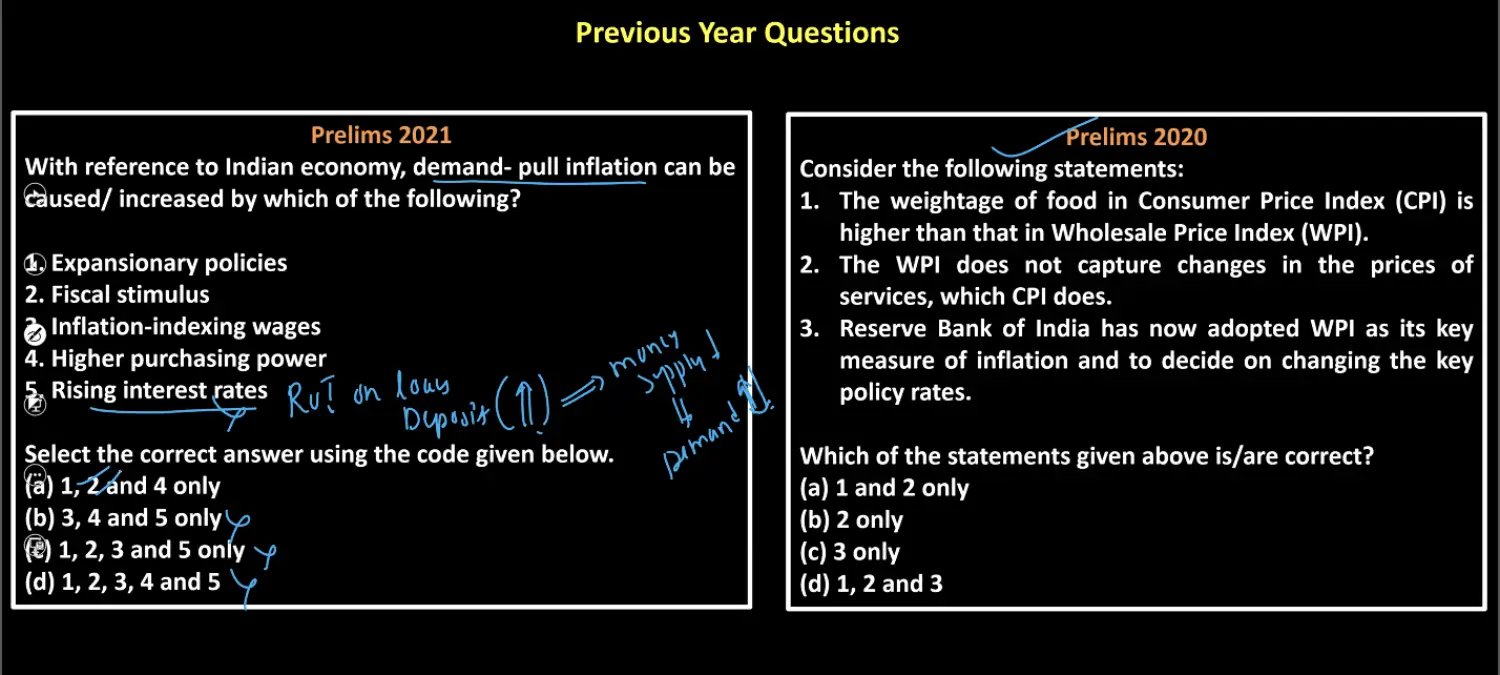
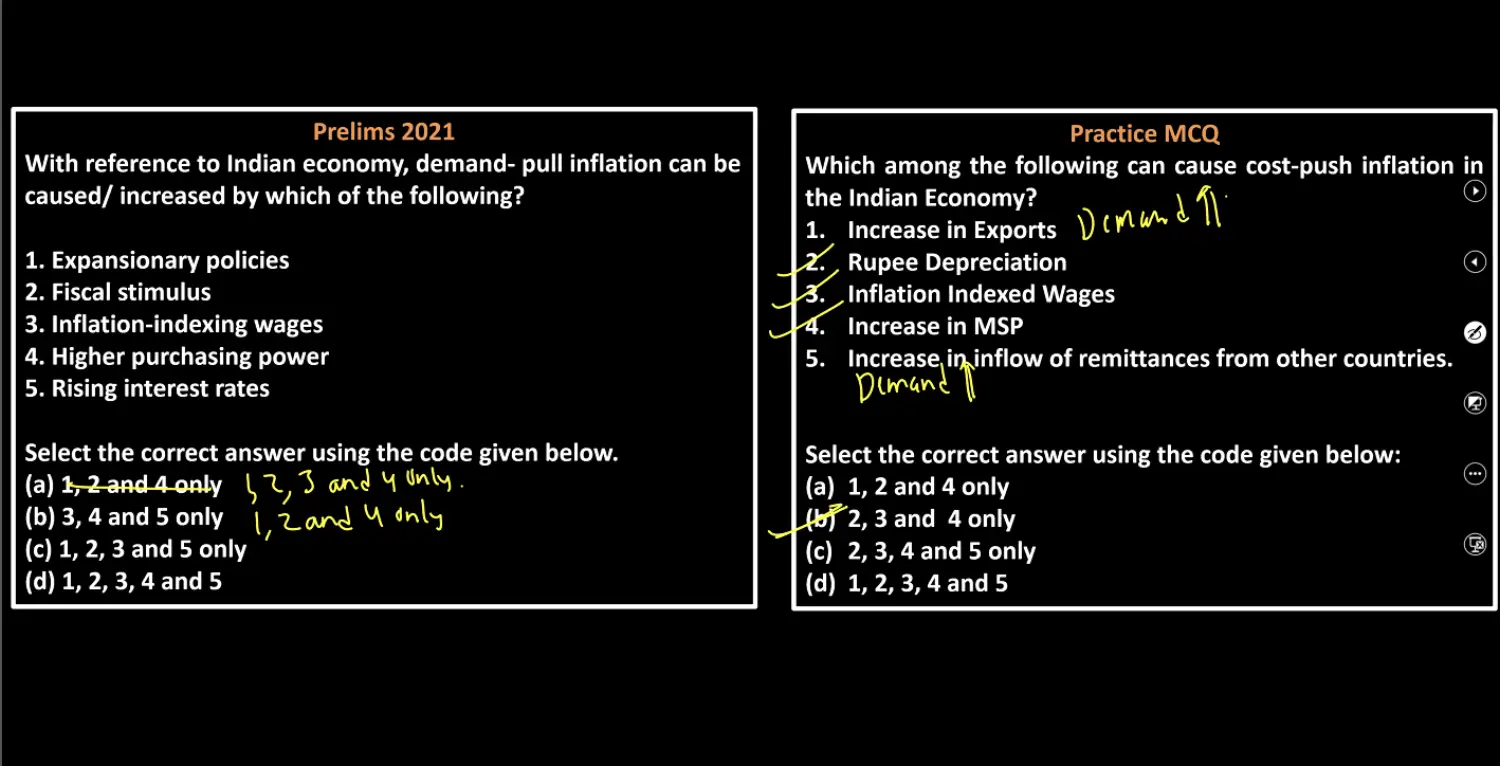
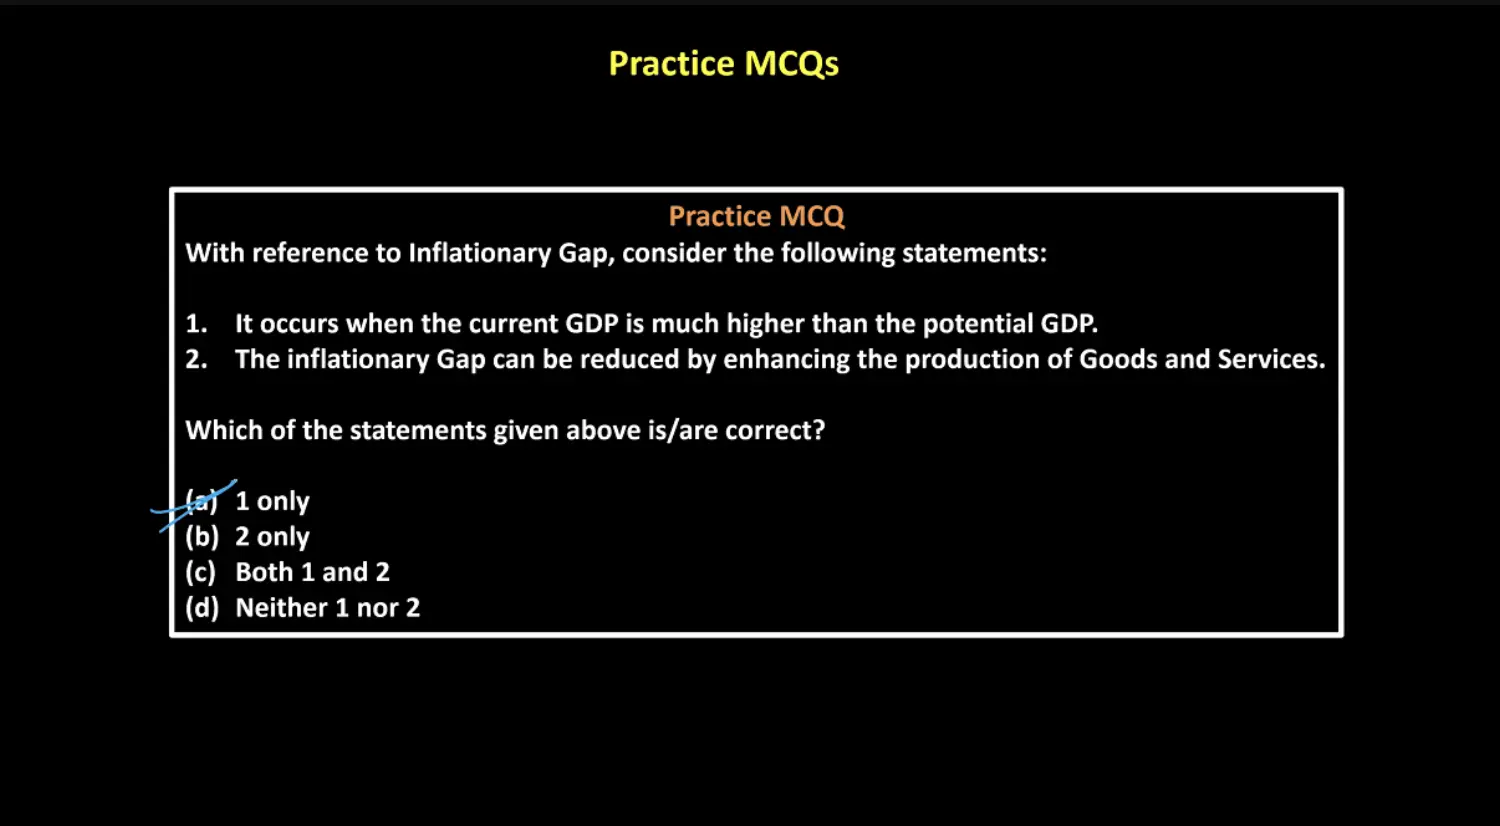
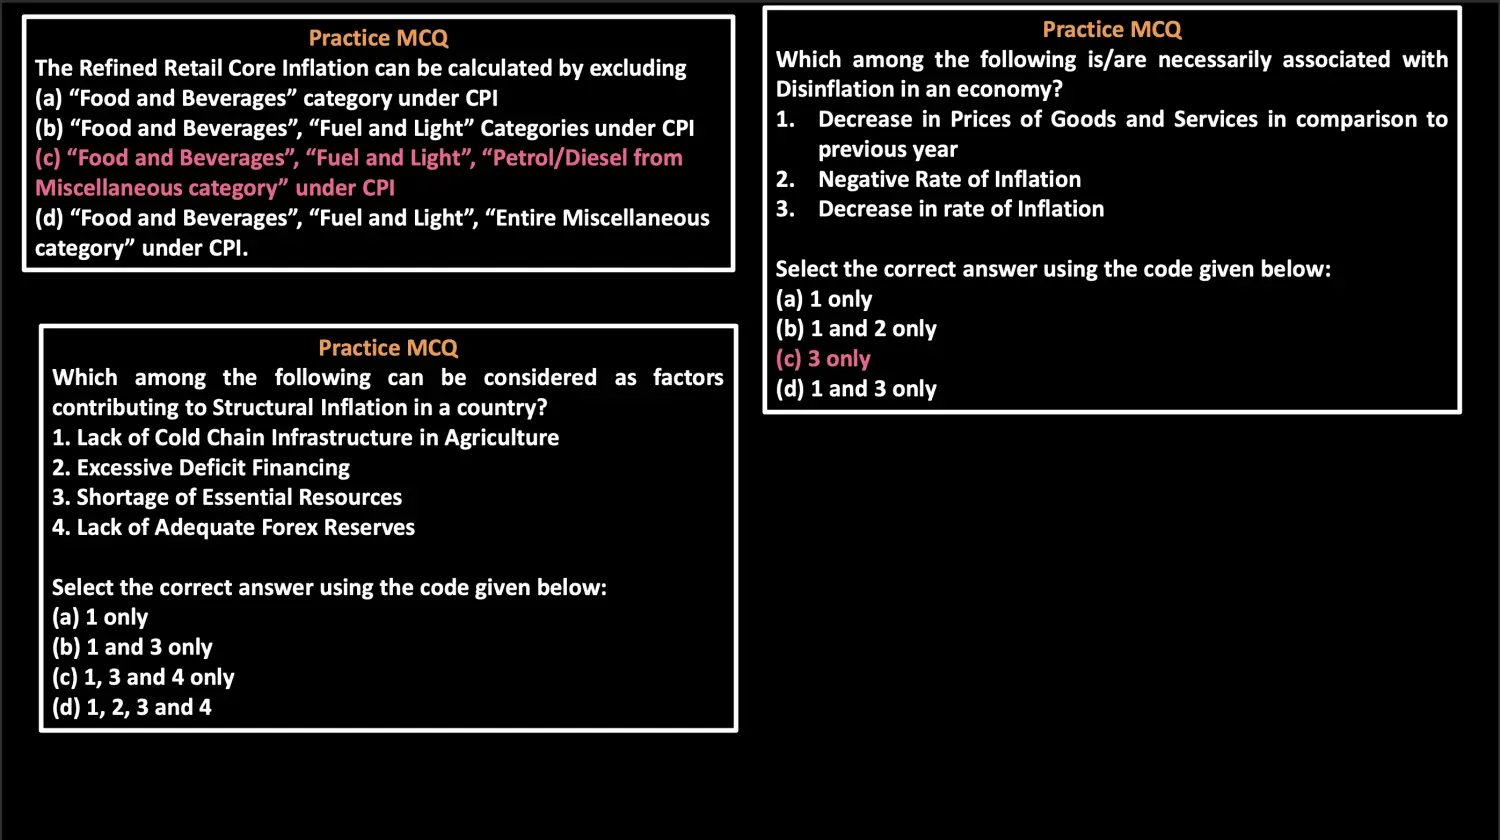
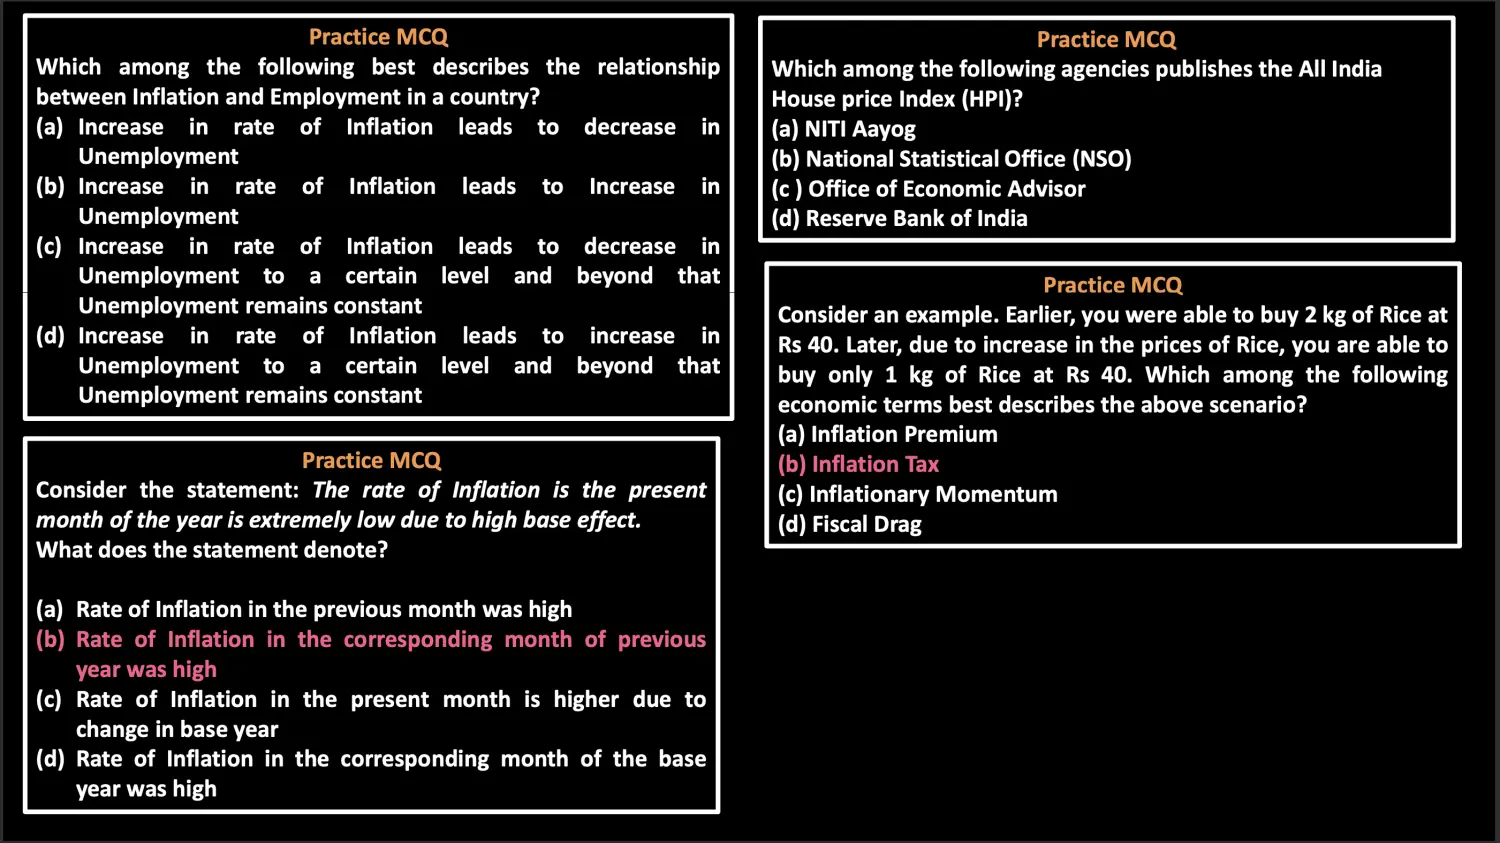
Inflation
Inflation Refers to a General and Persistent Increase in Prices of Goods and Services
Inflation should be Broad Based - Meaning Prices of Most of the Goods and Services should increase, not few !
Increase in price of a few commodity like Onion or Potato cannot be considered as Inflation
Persistent - On Continuous Basis it should Increase
Inflation is Measured in Terms of Percentage
For India it should be (4% +_ 2)
Point to Point Inflation
- Point to Point Inflation is also called as Year on Year Inflation
- Inflation is 4% wrt the Price of Commodity → in the Corresponding Month of Previous Year
Types of Inflation (Based on Rates)
Creeping Inflation ( Low to Moderate ROF )
For India its 2 to 4
Trotting Inflation (Not Moderate = Higher)
For India - 5 to 10
Galloping Inflation (Highest)
For India 10 to 20
Hyperinflation (Uncontrollable)
Greater than 20%
Examples
Historical Germany
Had Hyper Inflation After World War 1 Treaty of Versailles
Zimbabwe
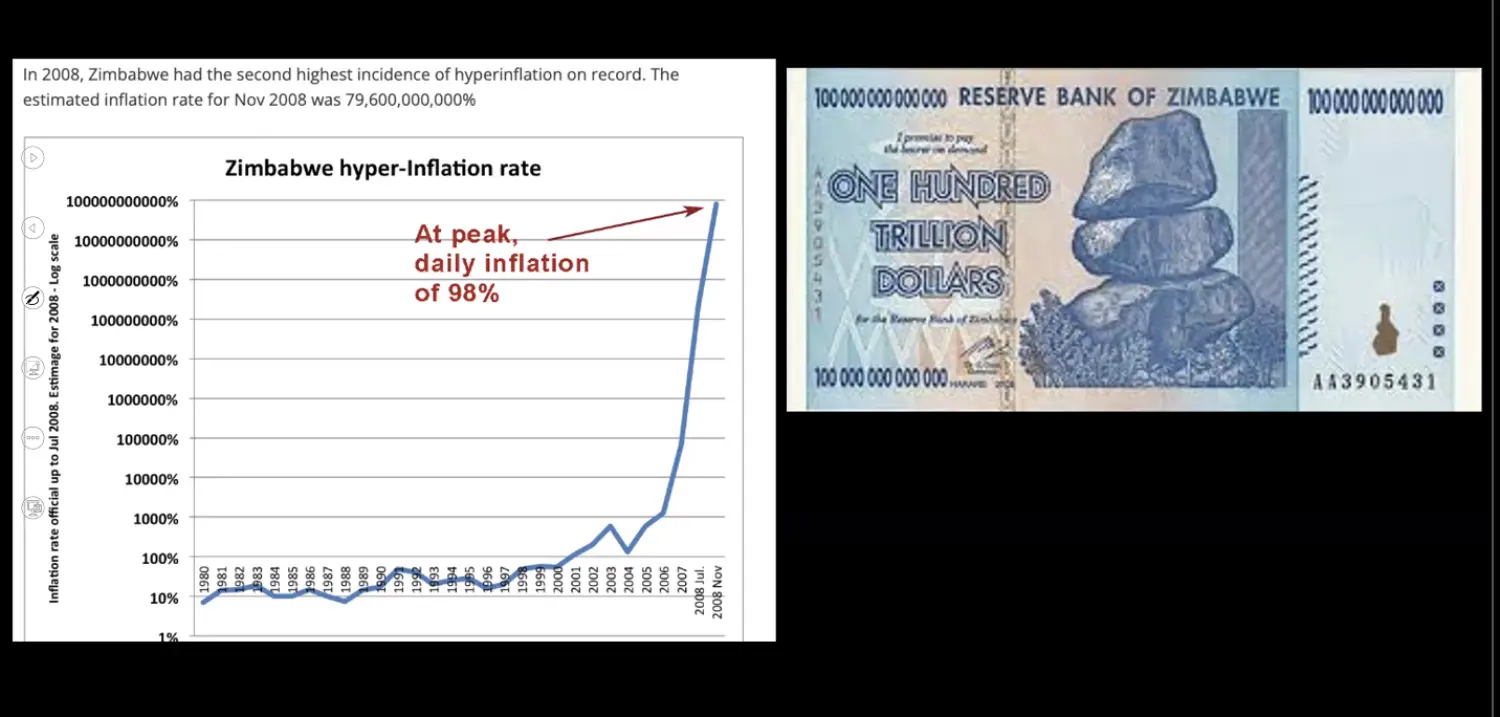
- Annual Rate of Inflation - 8 Lac Crores
- Daily Rate of Inflation - 100%
- A Loaf of Bread Costed - 55 Million USD
Iran
Iran was put under Economic Sanctions by US
Iran wasn't allowed to export crude oil to other countries
Hence, Dollar Inflow Into Iran Reduced - Thus the Iranian Currency got Reduced
Depreciated Due to → 1 $ = 41,000 Riyal
Imports into Iran Became Costly
Example: 1 Loaf of Bread was around 40,000 Riyal
What Did Iranian Central Bank → Issued a New Currency called Toman
Where 1 Toman = 40,000 Riyal
This Measure was Temporary
This is called as Redenomination
WPI & CPI
Inflation at Wholesale Level - WPI
Inflation at Consumer Level - CPI
PS: There is Generally Divergence Between WPI & CPI ; but in theory they should go up and down together
Terms Related to Inflation
💡 Inflation, Deflation, Disinflation, Reflation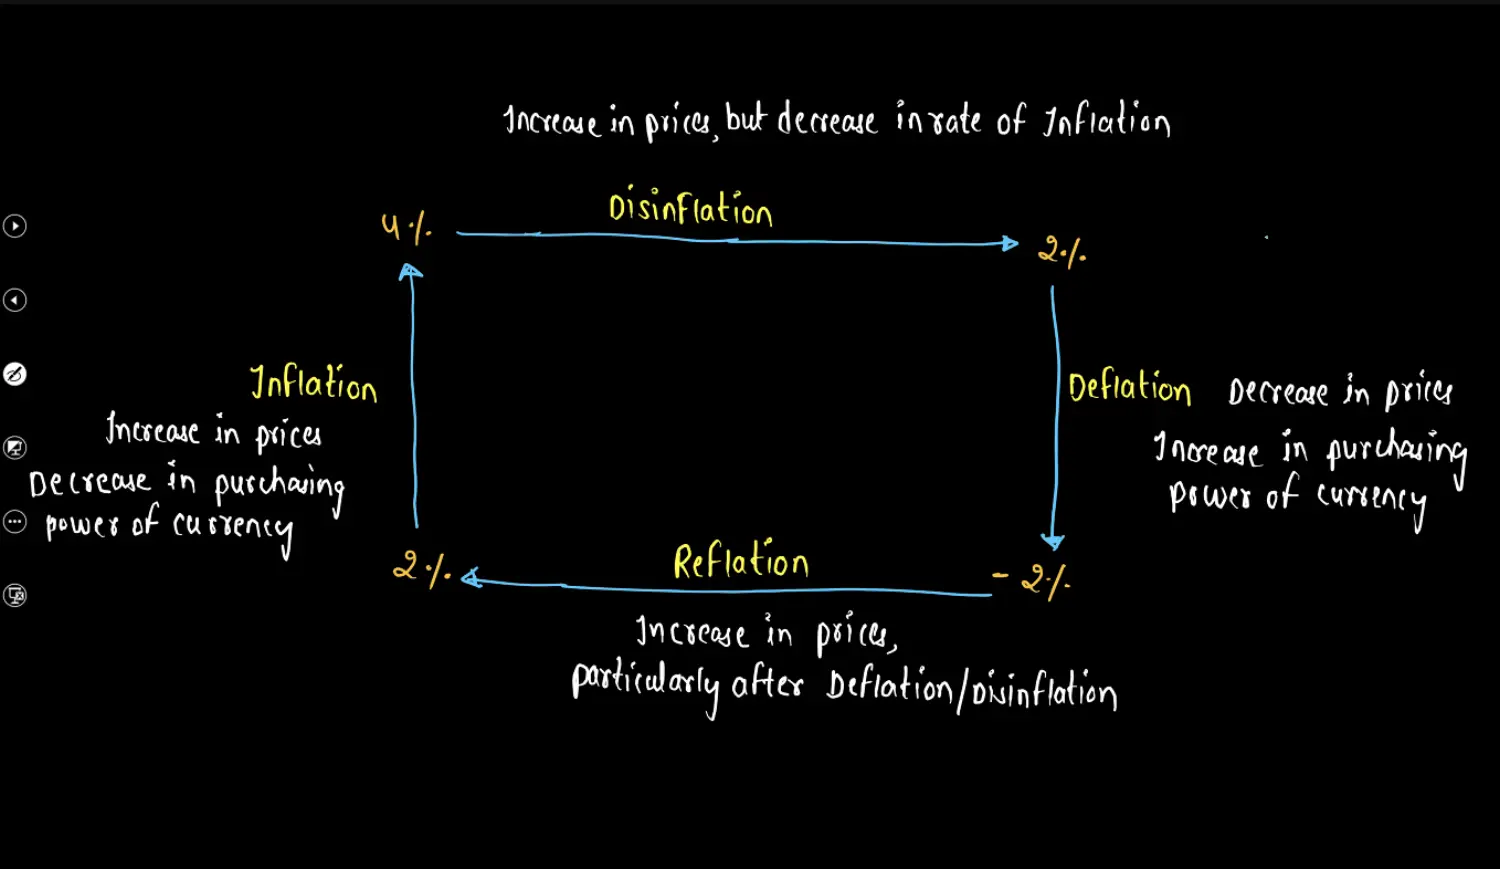
- A High Rate of Inflation and Zero Rate of Inflation are Equally Bad
- Ideal Rate of Inflation for India is 4%
- Current Rate of Inflation in India is : CPI 5.72%
Base Effect
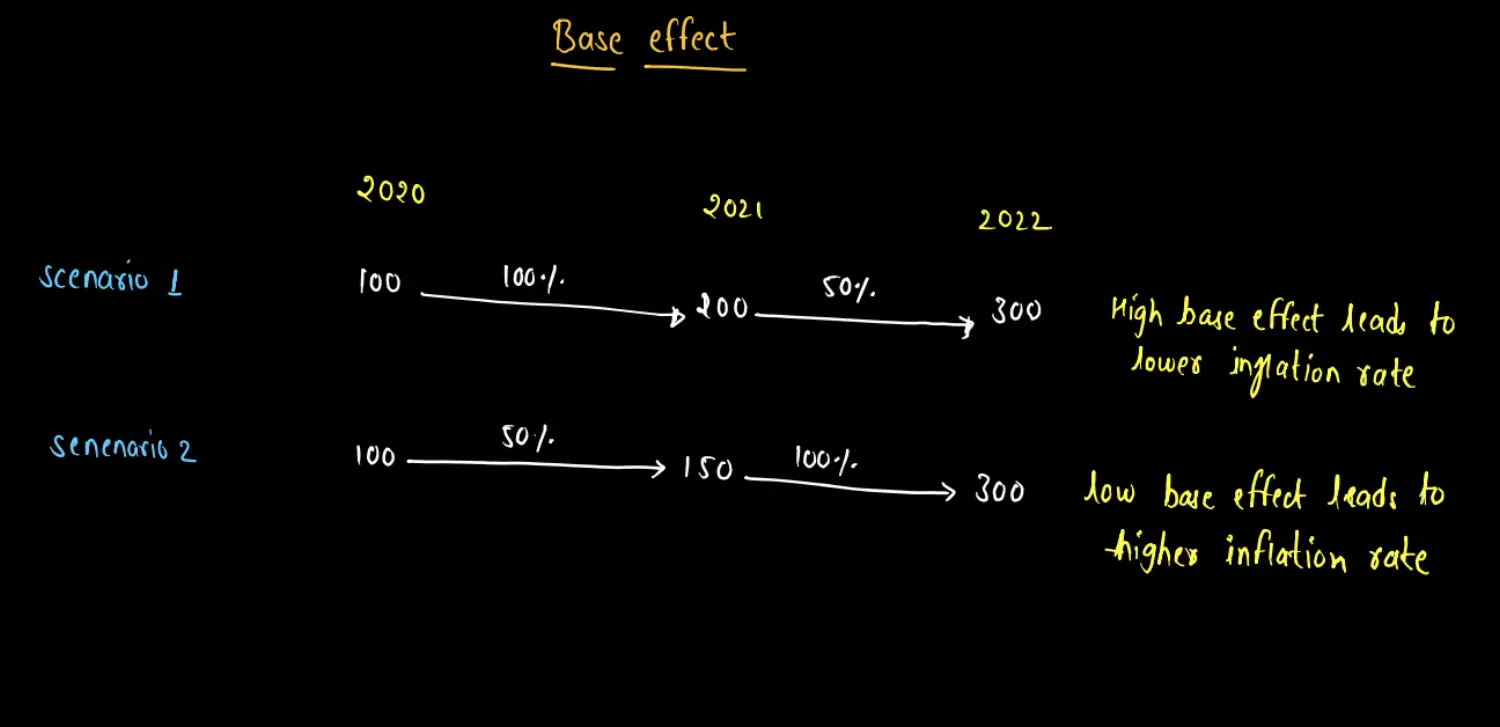
Comparison wrt to Base or a Reference may distort the Reality is called Base Effect
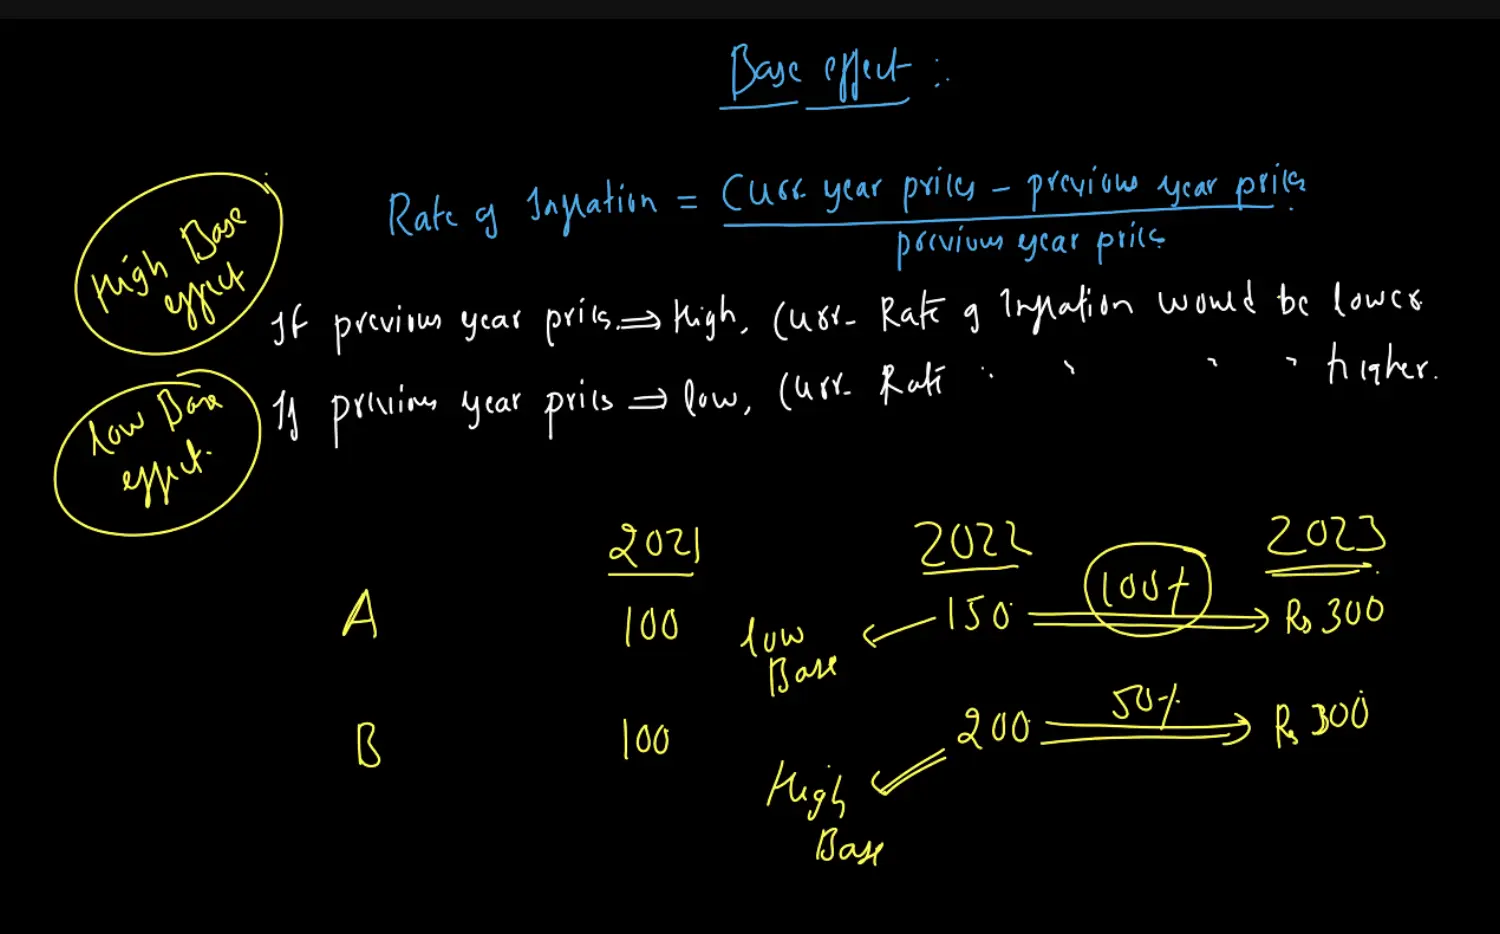
Rate of Inflation = (Current Year Prices - Previous Year Prices) / Previous Year Prices
Here Previous Year Prices is the Base Year
as PYP is in Denominator →
- If PYP is High - Rate of Inflation would be Lower → This is called as High Base Effect
- if PYP is Low - Rate of Inflation would be Higher → This is called as Low Base Effect
Example
Phillips Curve
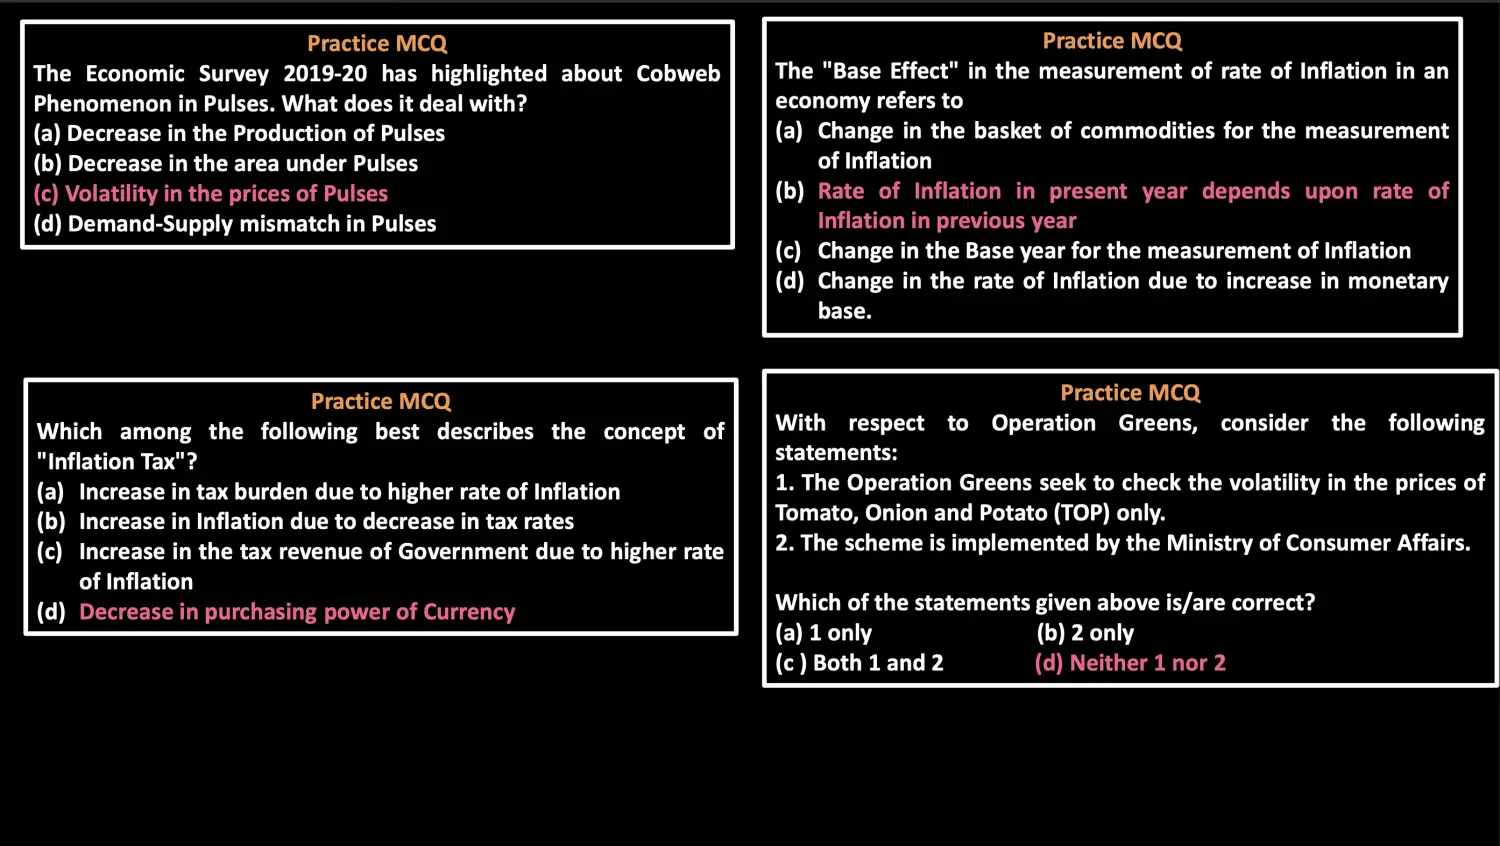
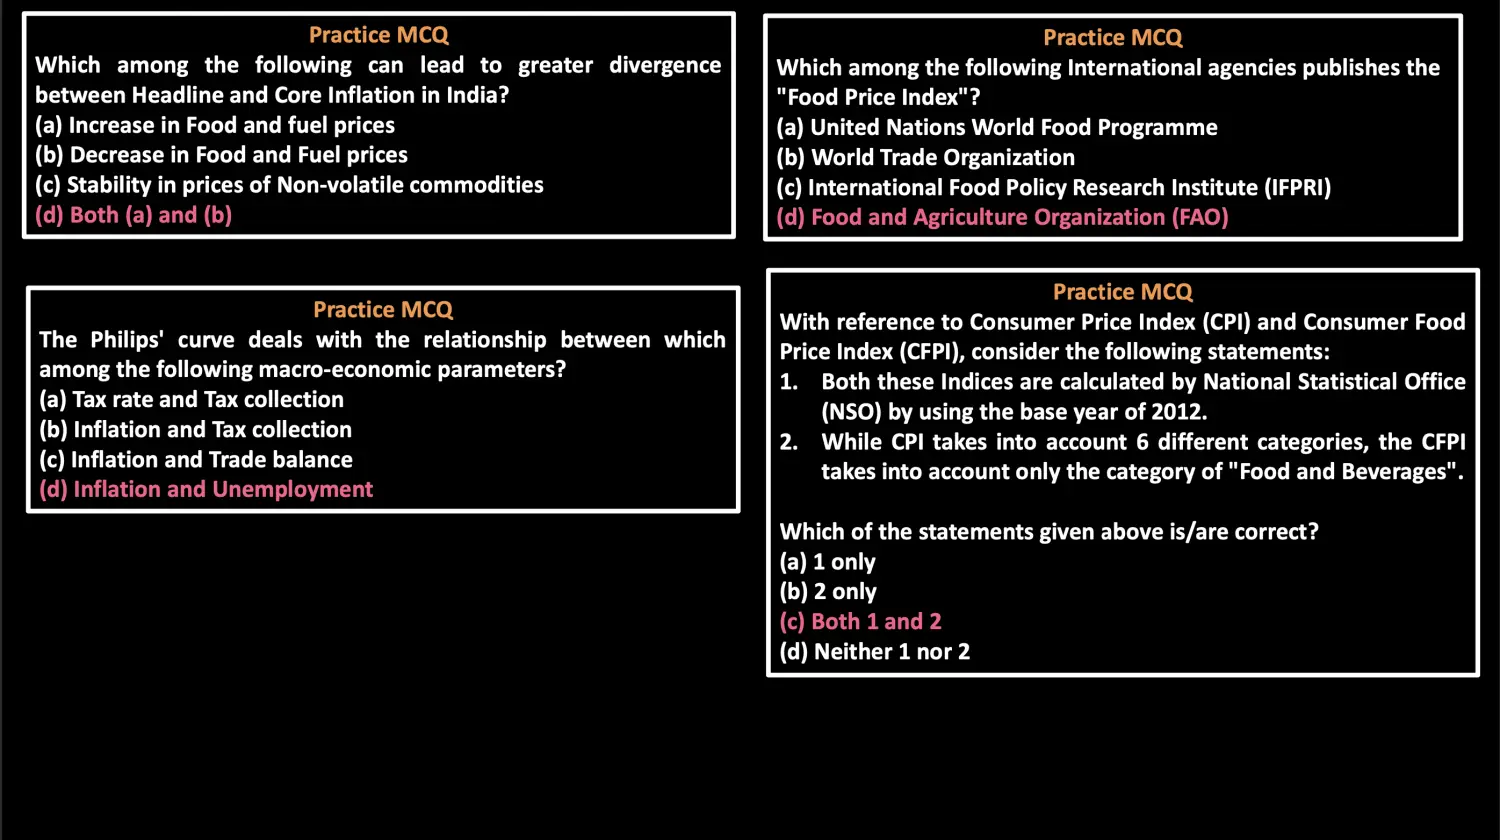
Phillips Curve Shows Relationship Between Inflation & Unemployment Rate
Before 1970’s - According to Phillips Curve
This will fail in Hyper Inflation. It is Possible only in Short Term.
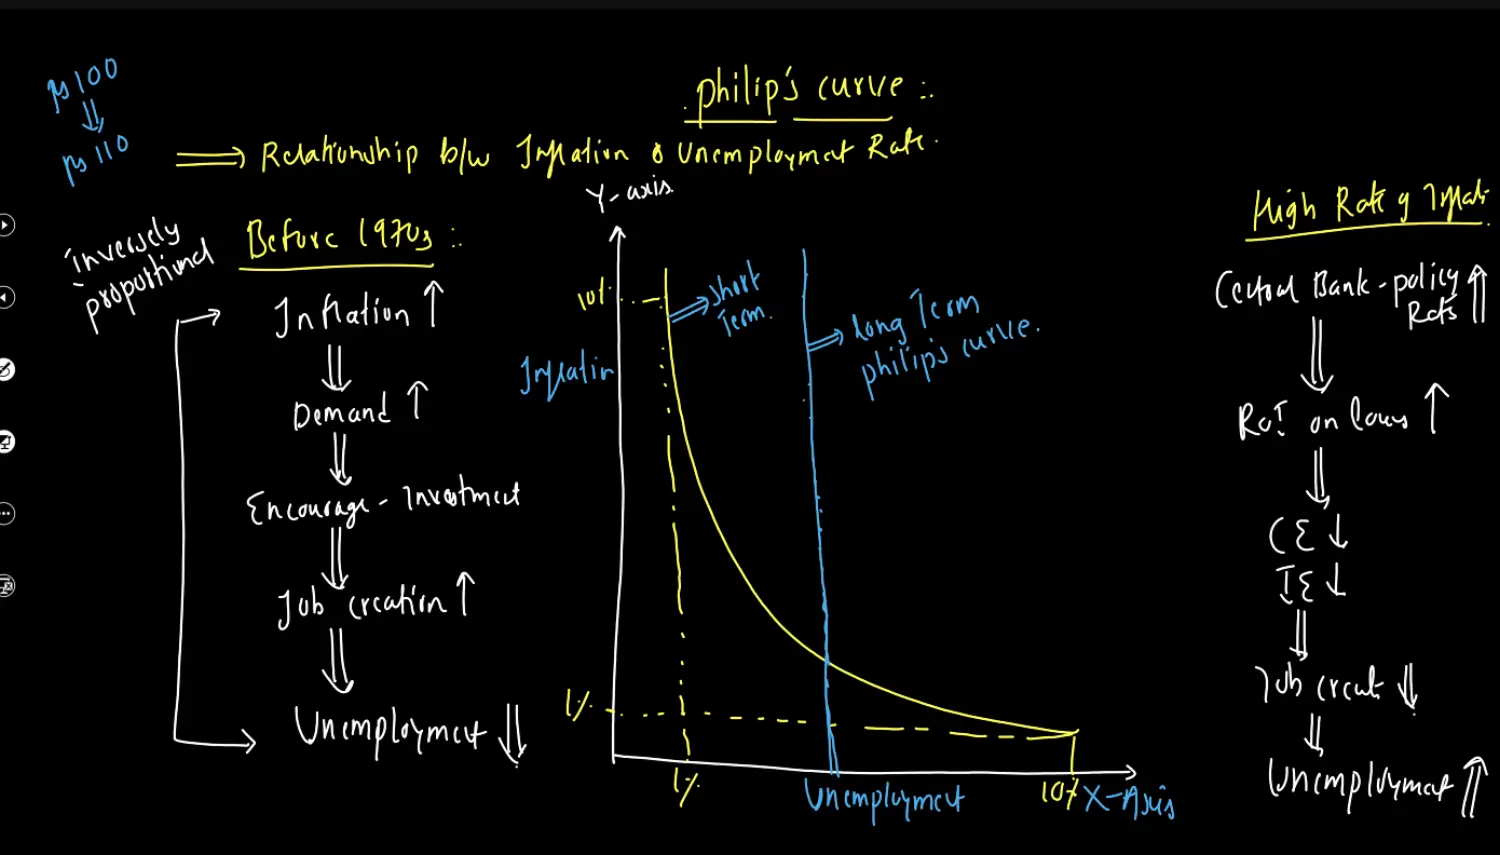
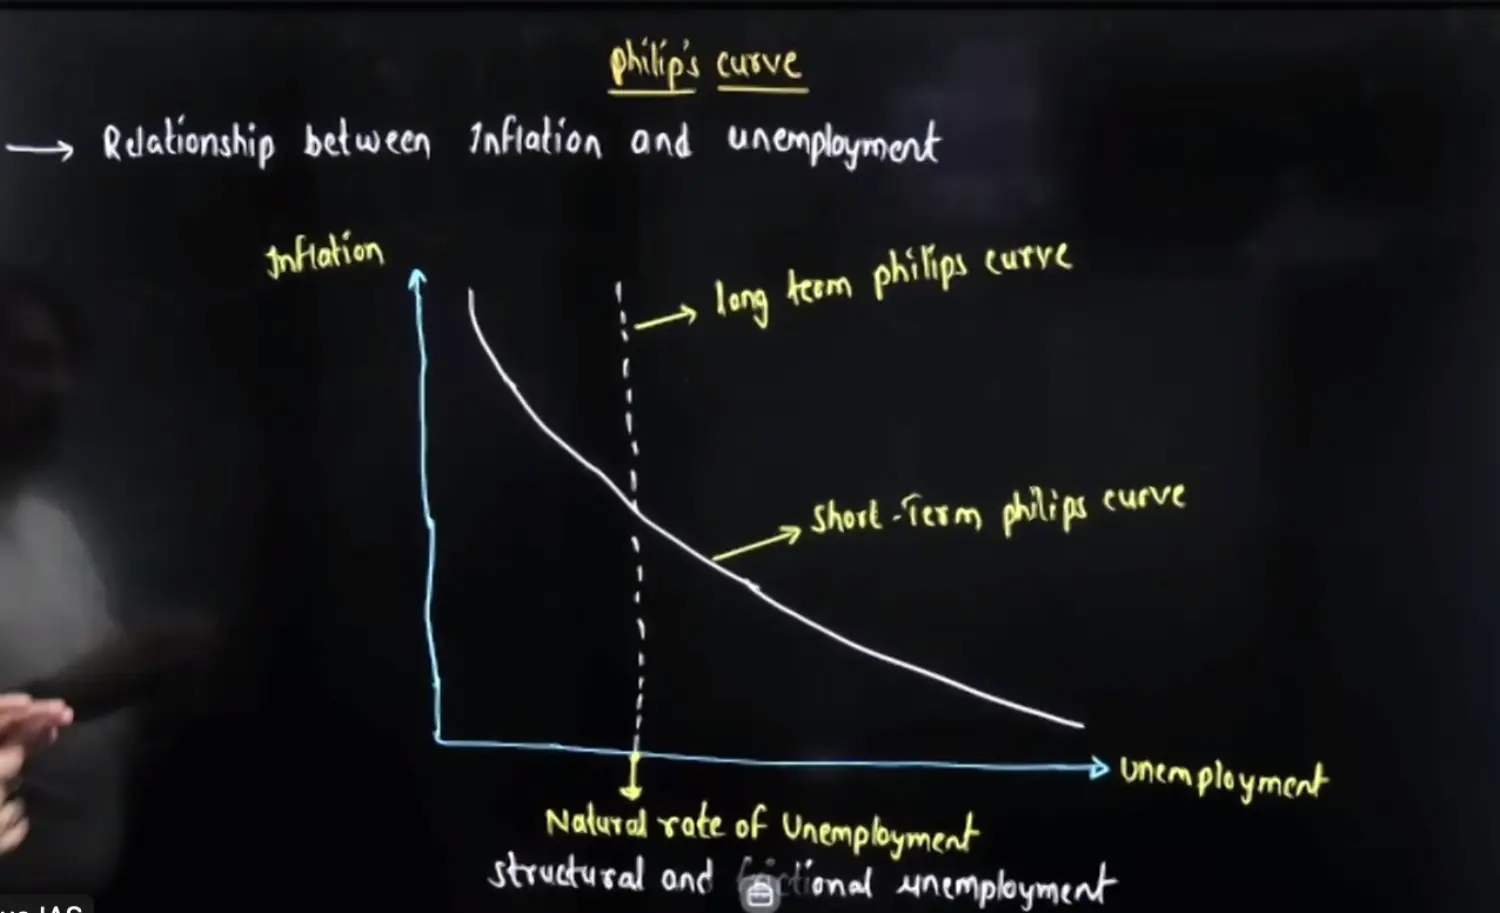
Long Term Curve Says - In Any Country Unemployment is Independent from Rate of Inflation
No Matter How Low or High Rate of Inflation in a Country is - There will always be some unemployment → Hence it is called as Natural Rate of Unemployment
Natural Rate of Unemployment
Structural Unemployment: Form of Unemployment due to miss match between skill set of person and demand of Job
When Skill Set is Lower than Demand of the Job
Example: in 1990’s People were expert in typewriters, after introduction of computer, demand of job increased, people not knowing computer but knew how to typewrite
Example: Due to Machines, people in car manufacturing industry may be reduced
Example: Tesla Replacing Driver
Example: IT Engineers that don't have new Skills
Under Employment: Skill Set is Higher than Demand of the Job
Example: Engineer employed in BPO Sector
Frictional Unemployment : A Temporary Form of Unemployment, when a person is switching Job, Hence he is Unemployed for a Particular Time Period
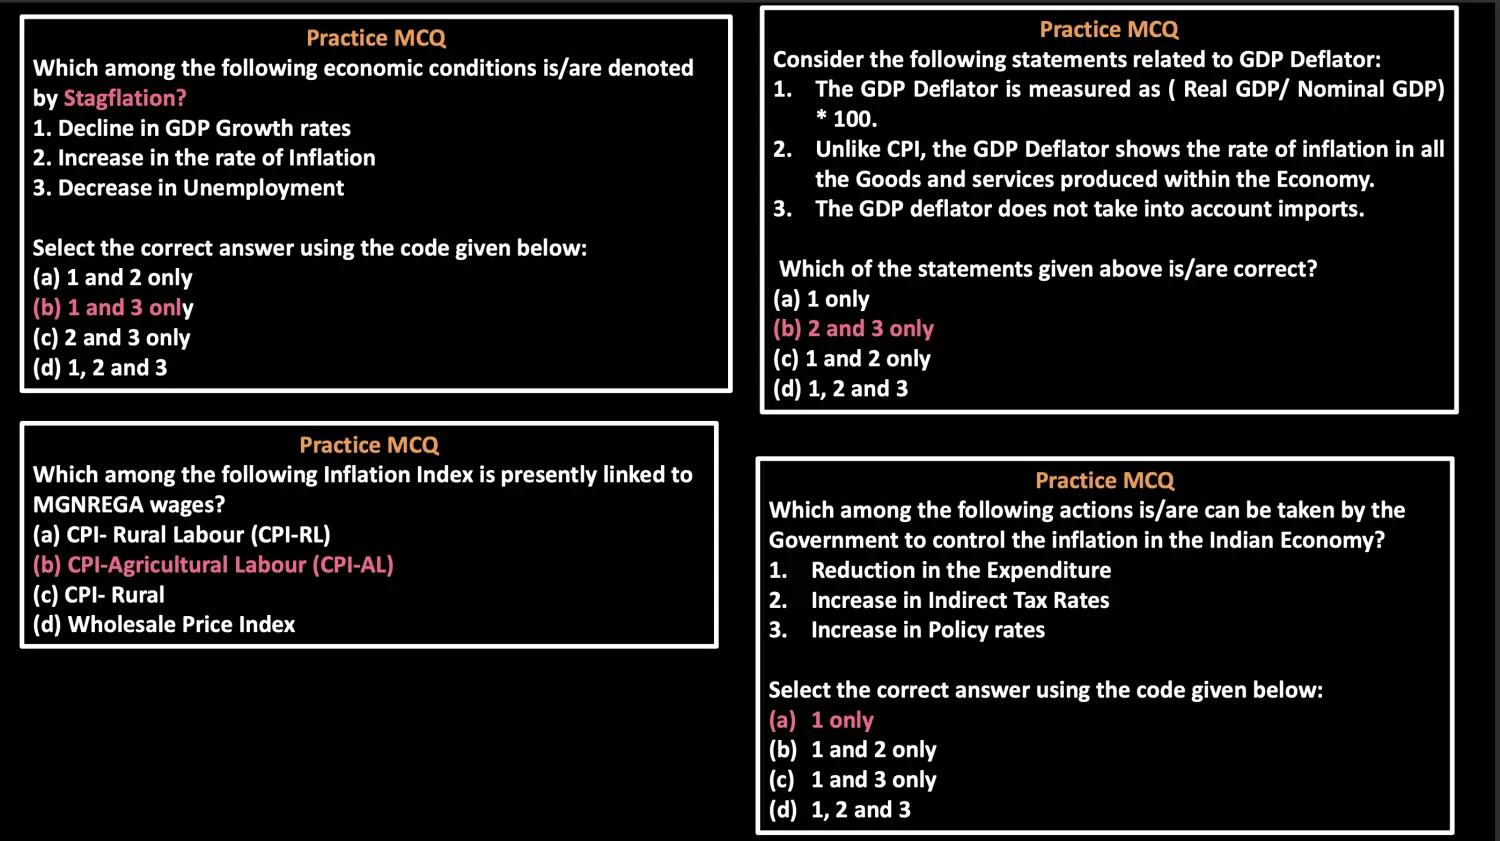
Stagflation
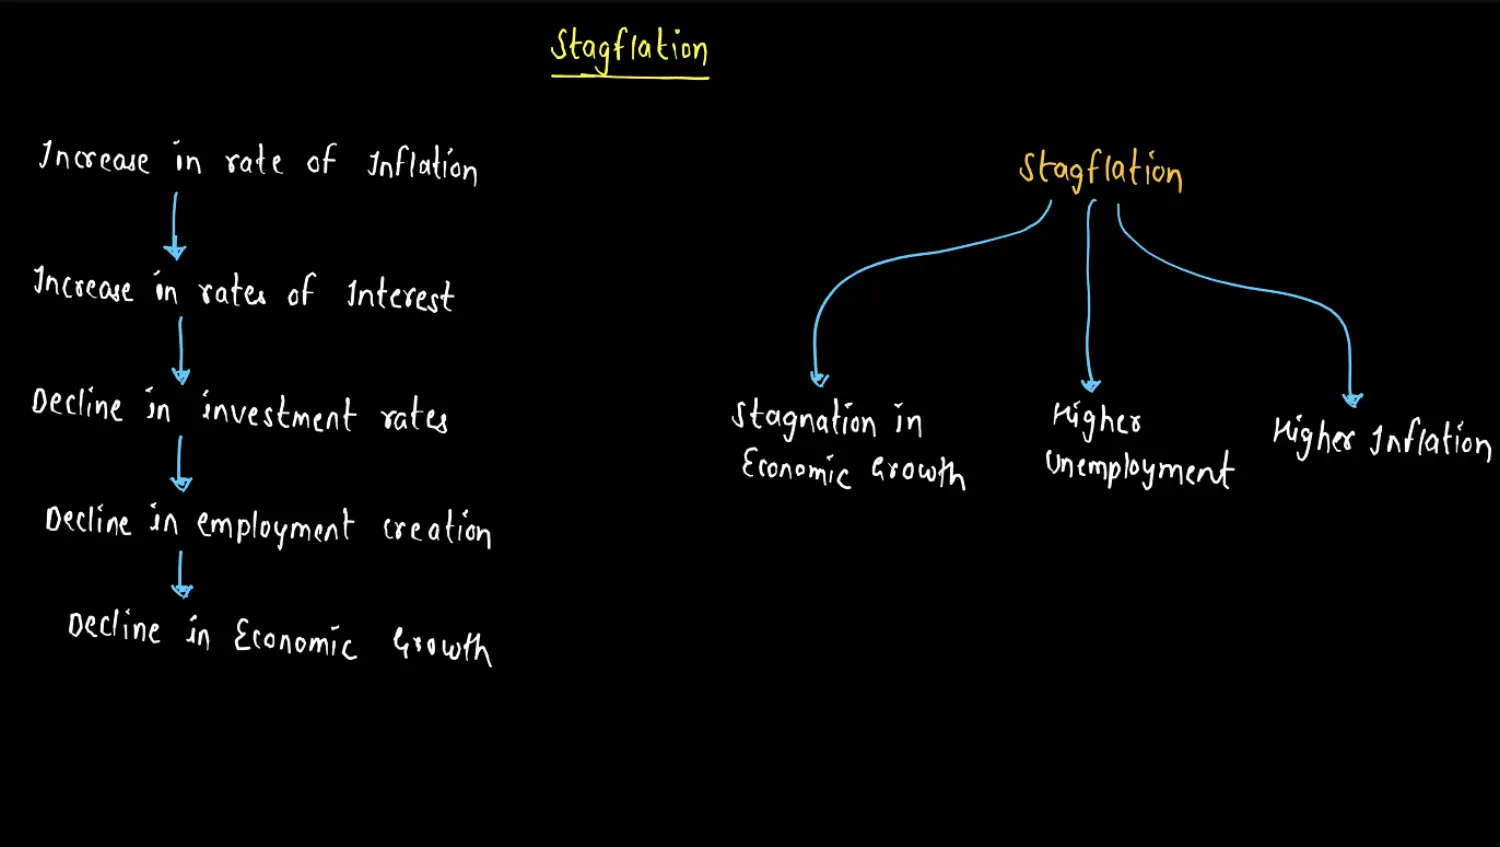
- Stagflation is combination of Stagnation & Inflation
- It Means
- GDP is Going Down
- Inflation is High
- Unemployment is High
Inflation Tax
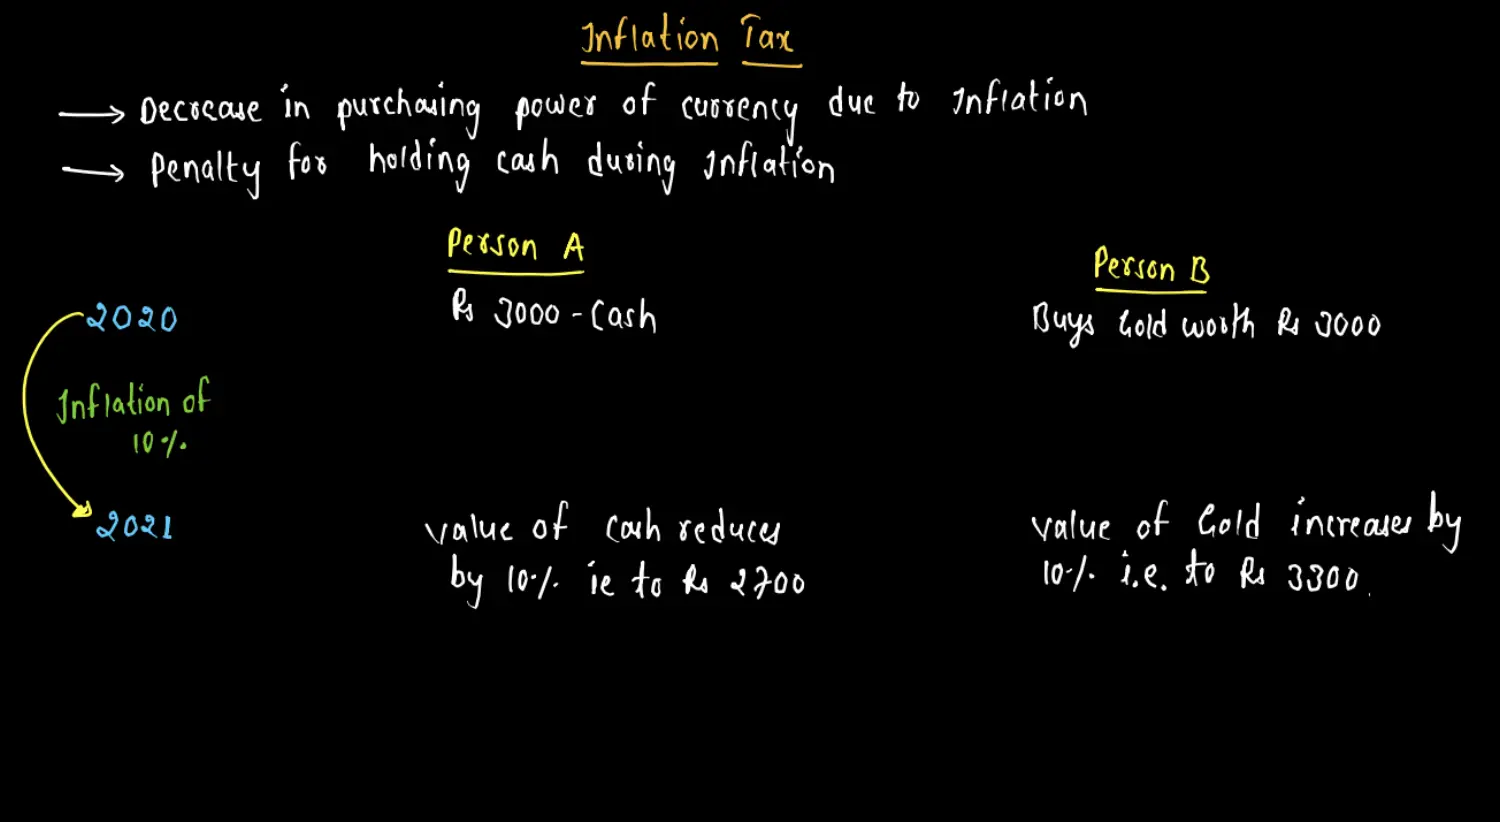
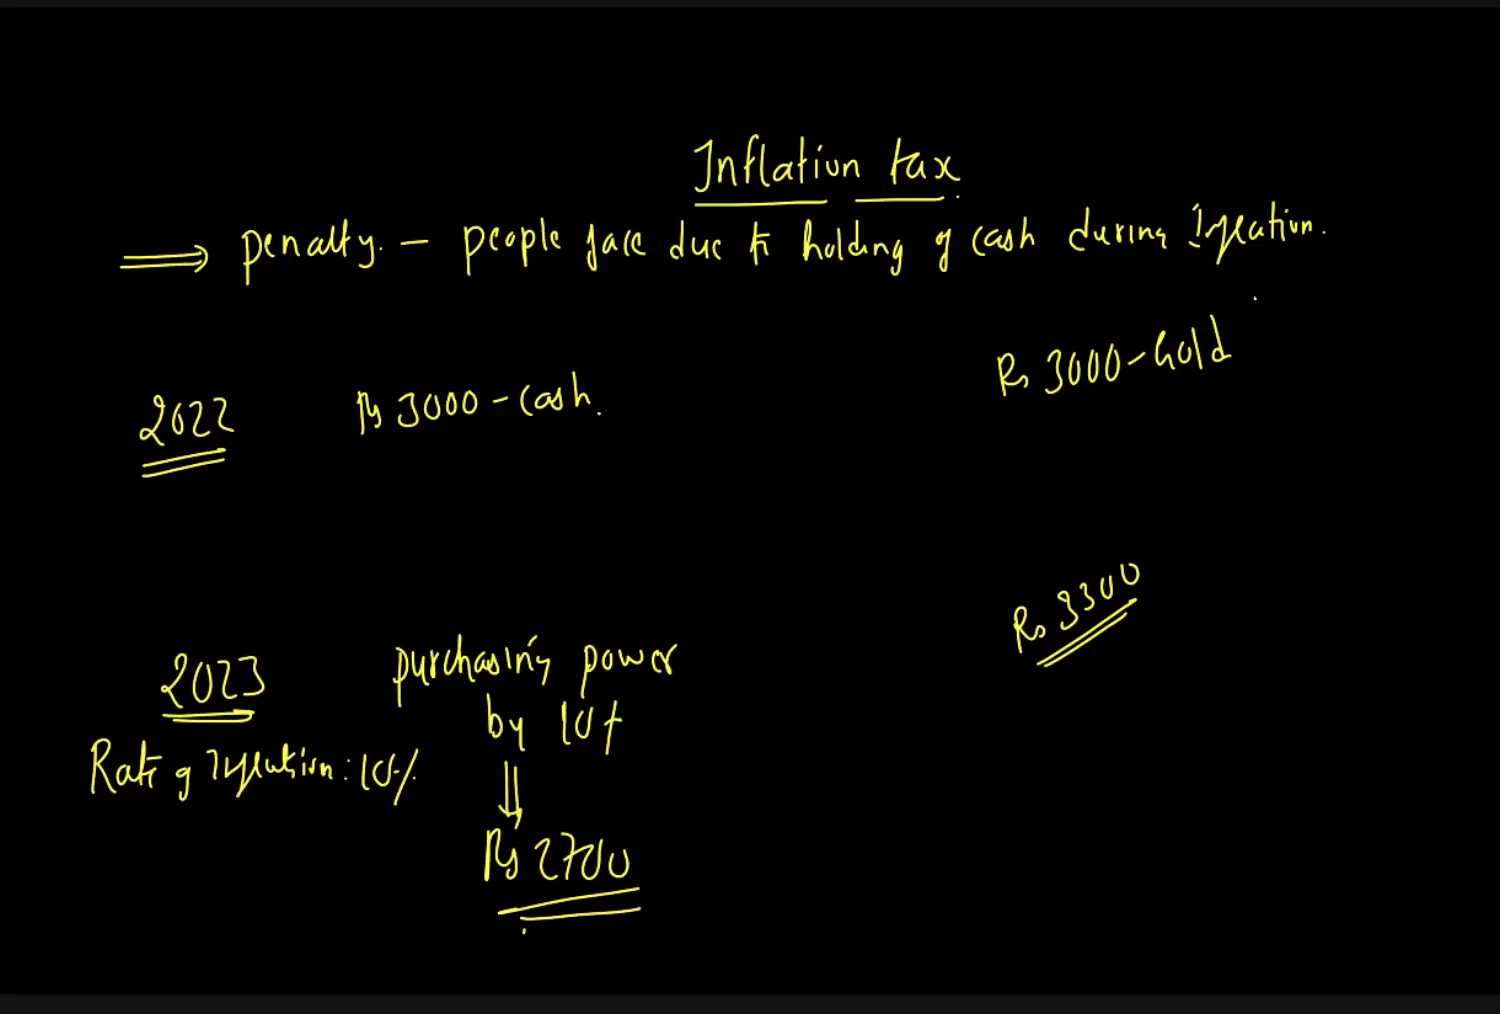
It is a Penalty and it is nowhere related to Taxation System
It is a Kind of Penalty which people face due to holding of cash, during inflation
Holding of Cash, Leads to Decrease in Purchasing Power of Rupee
Hence, this Decreased Purchasing Power is called as Tax or rather Inflation Tax
Due to Inflation Tax, Investments in Speculative Investment Increases
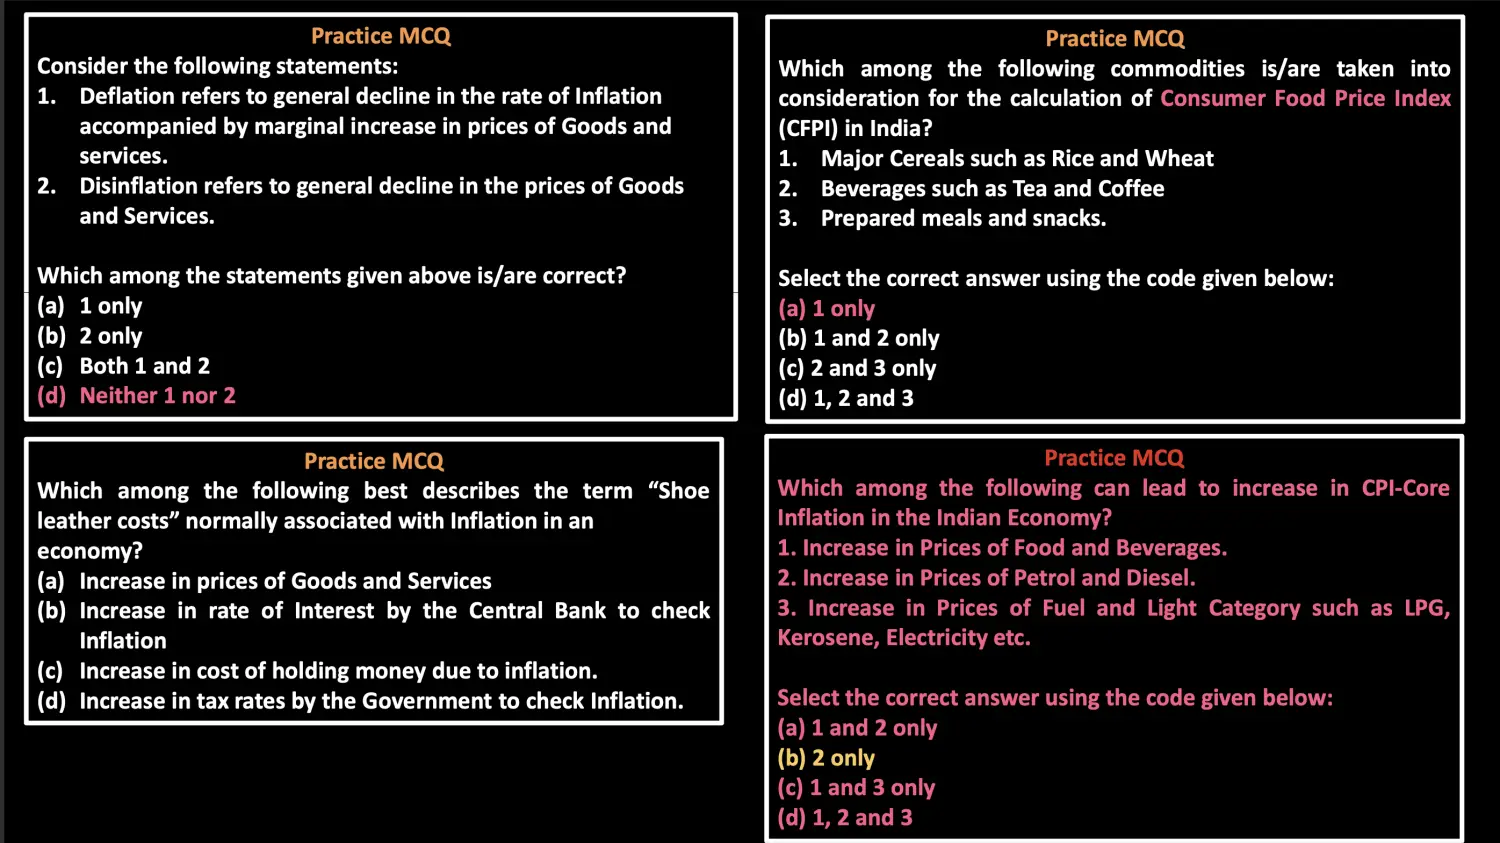
Shoe Leather Cost
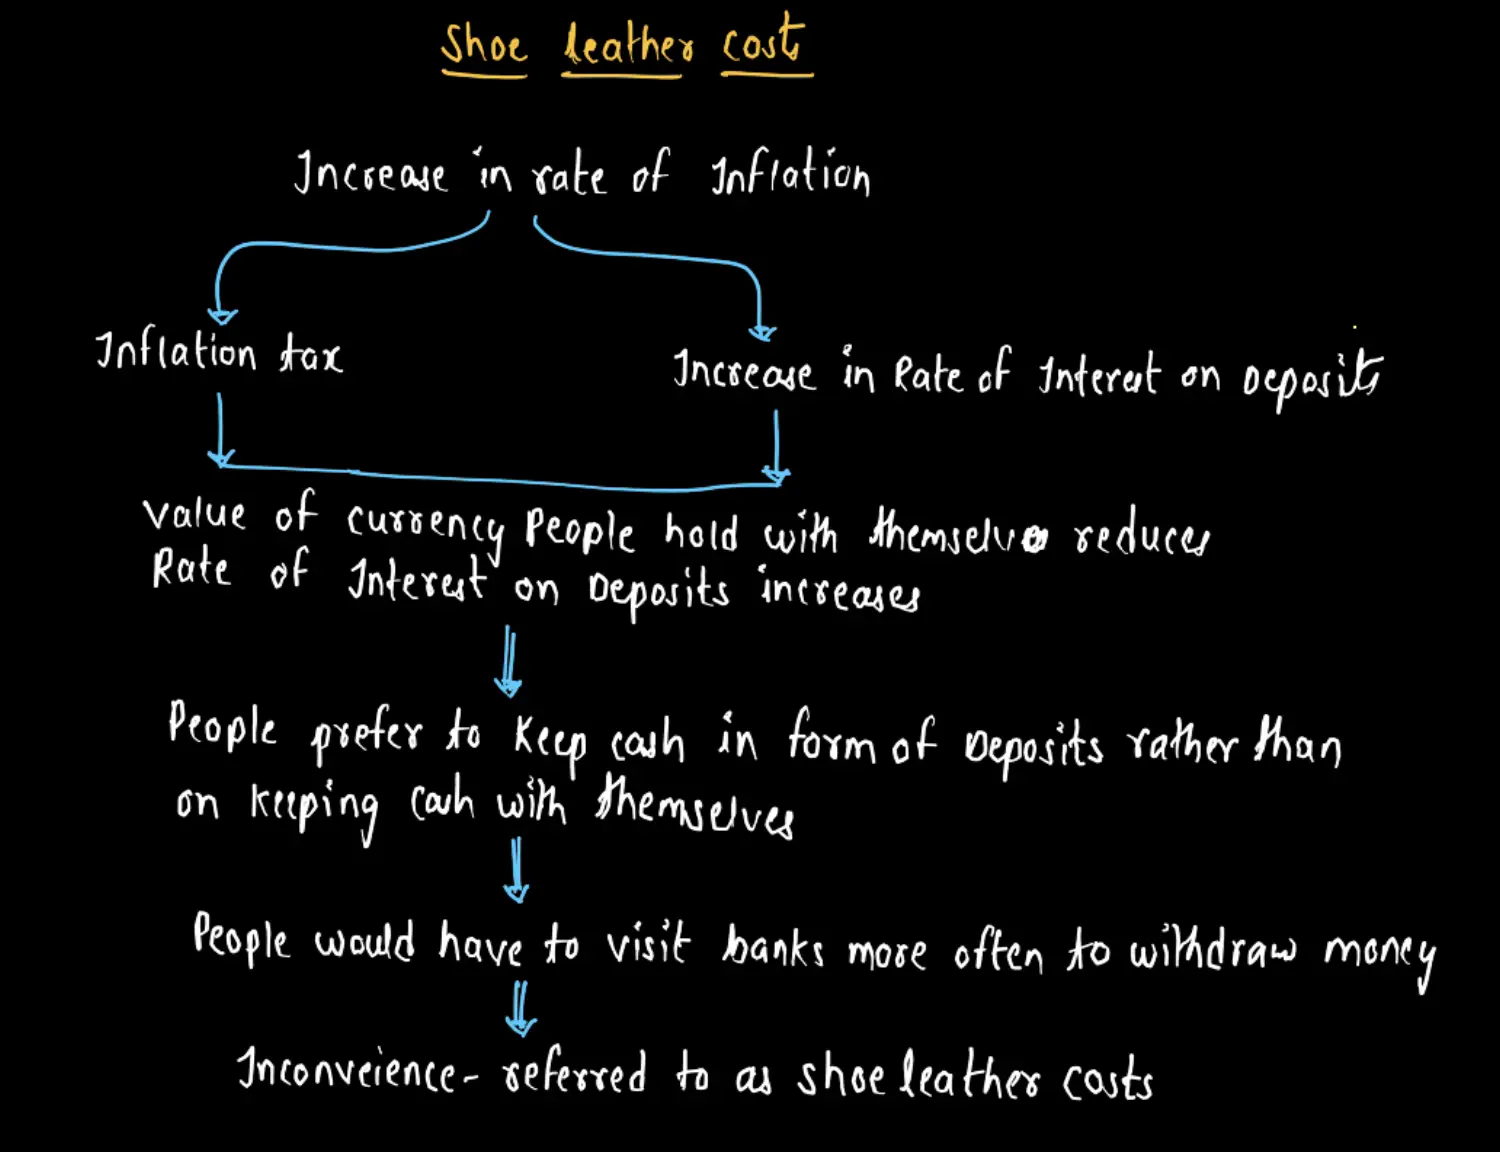
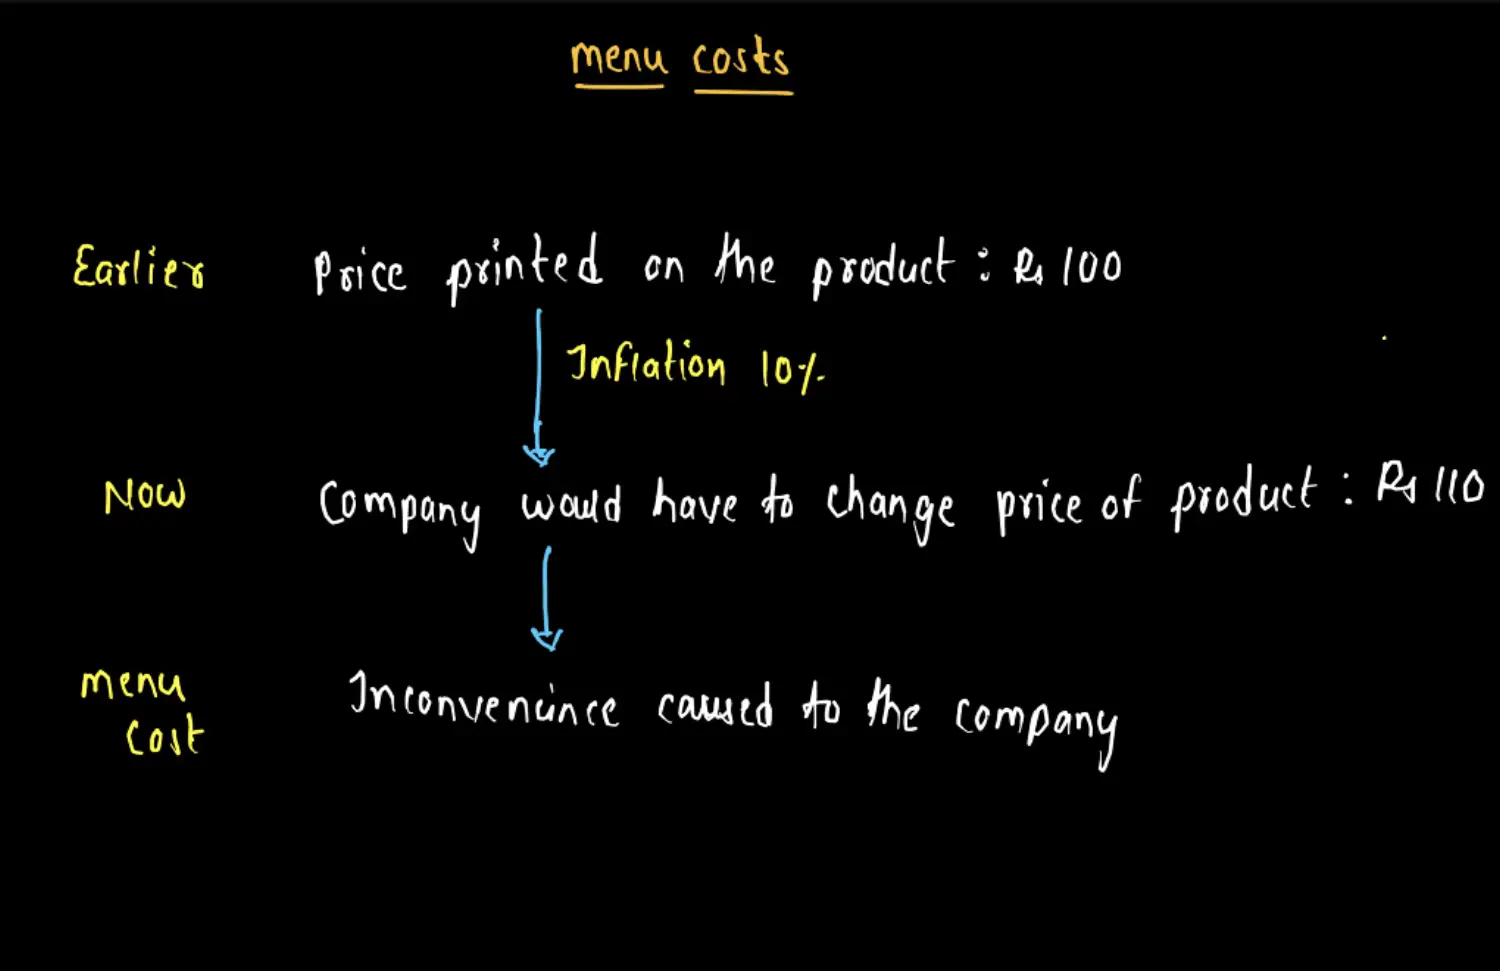
Menu Cost
Inconvenience caused to the Manufacturers in changing prices !!
Skewflation & Shrinkflation
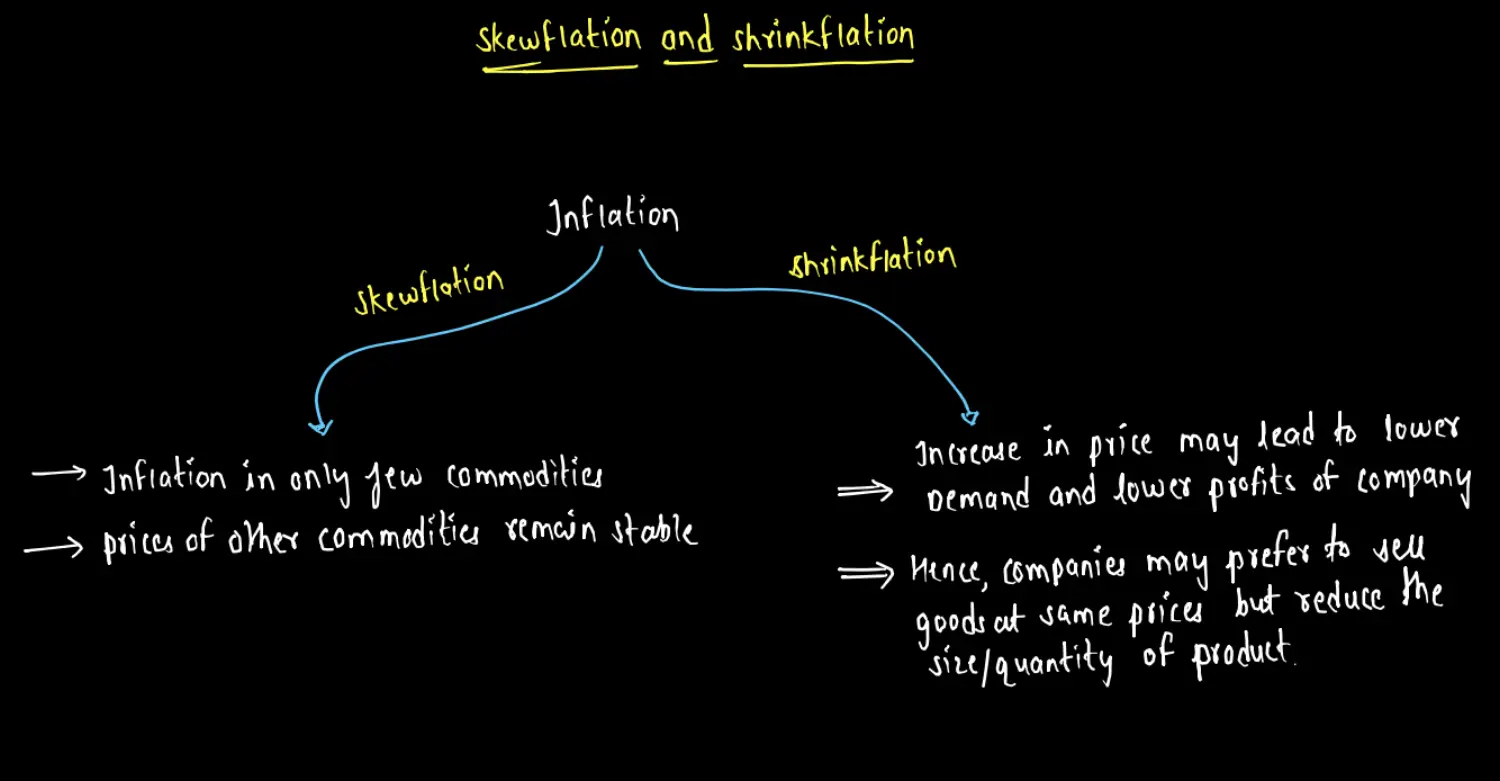
Skewflation: Prices of Only Few Commodities Increase
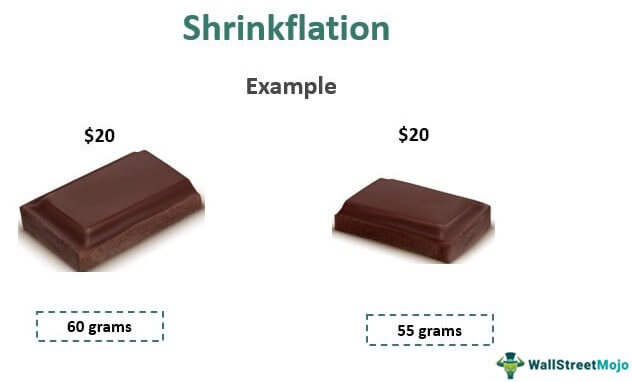
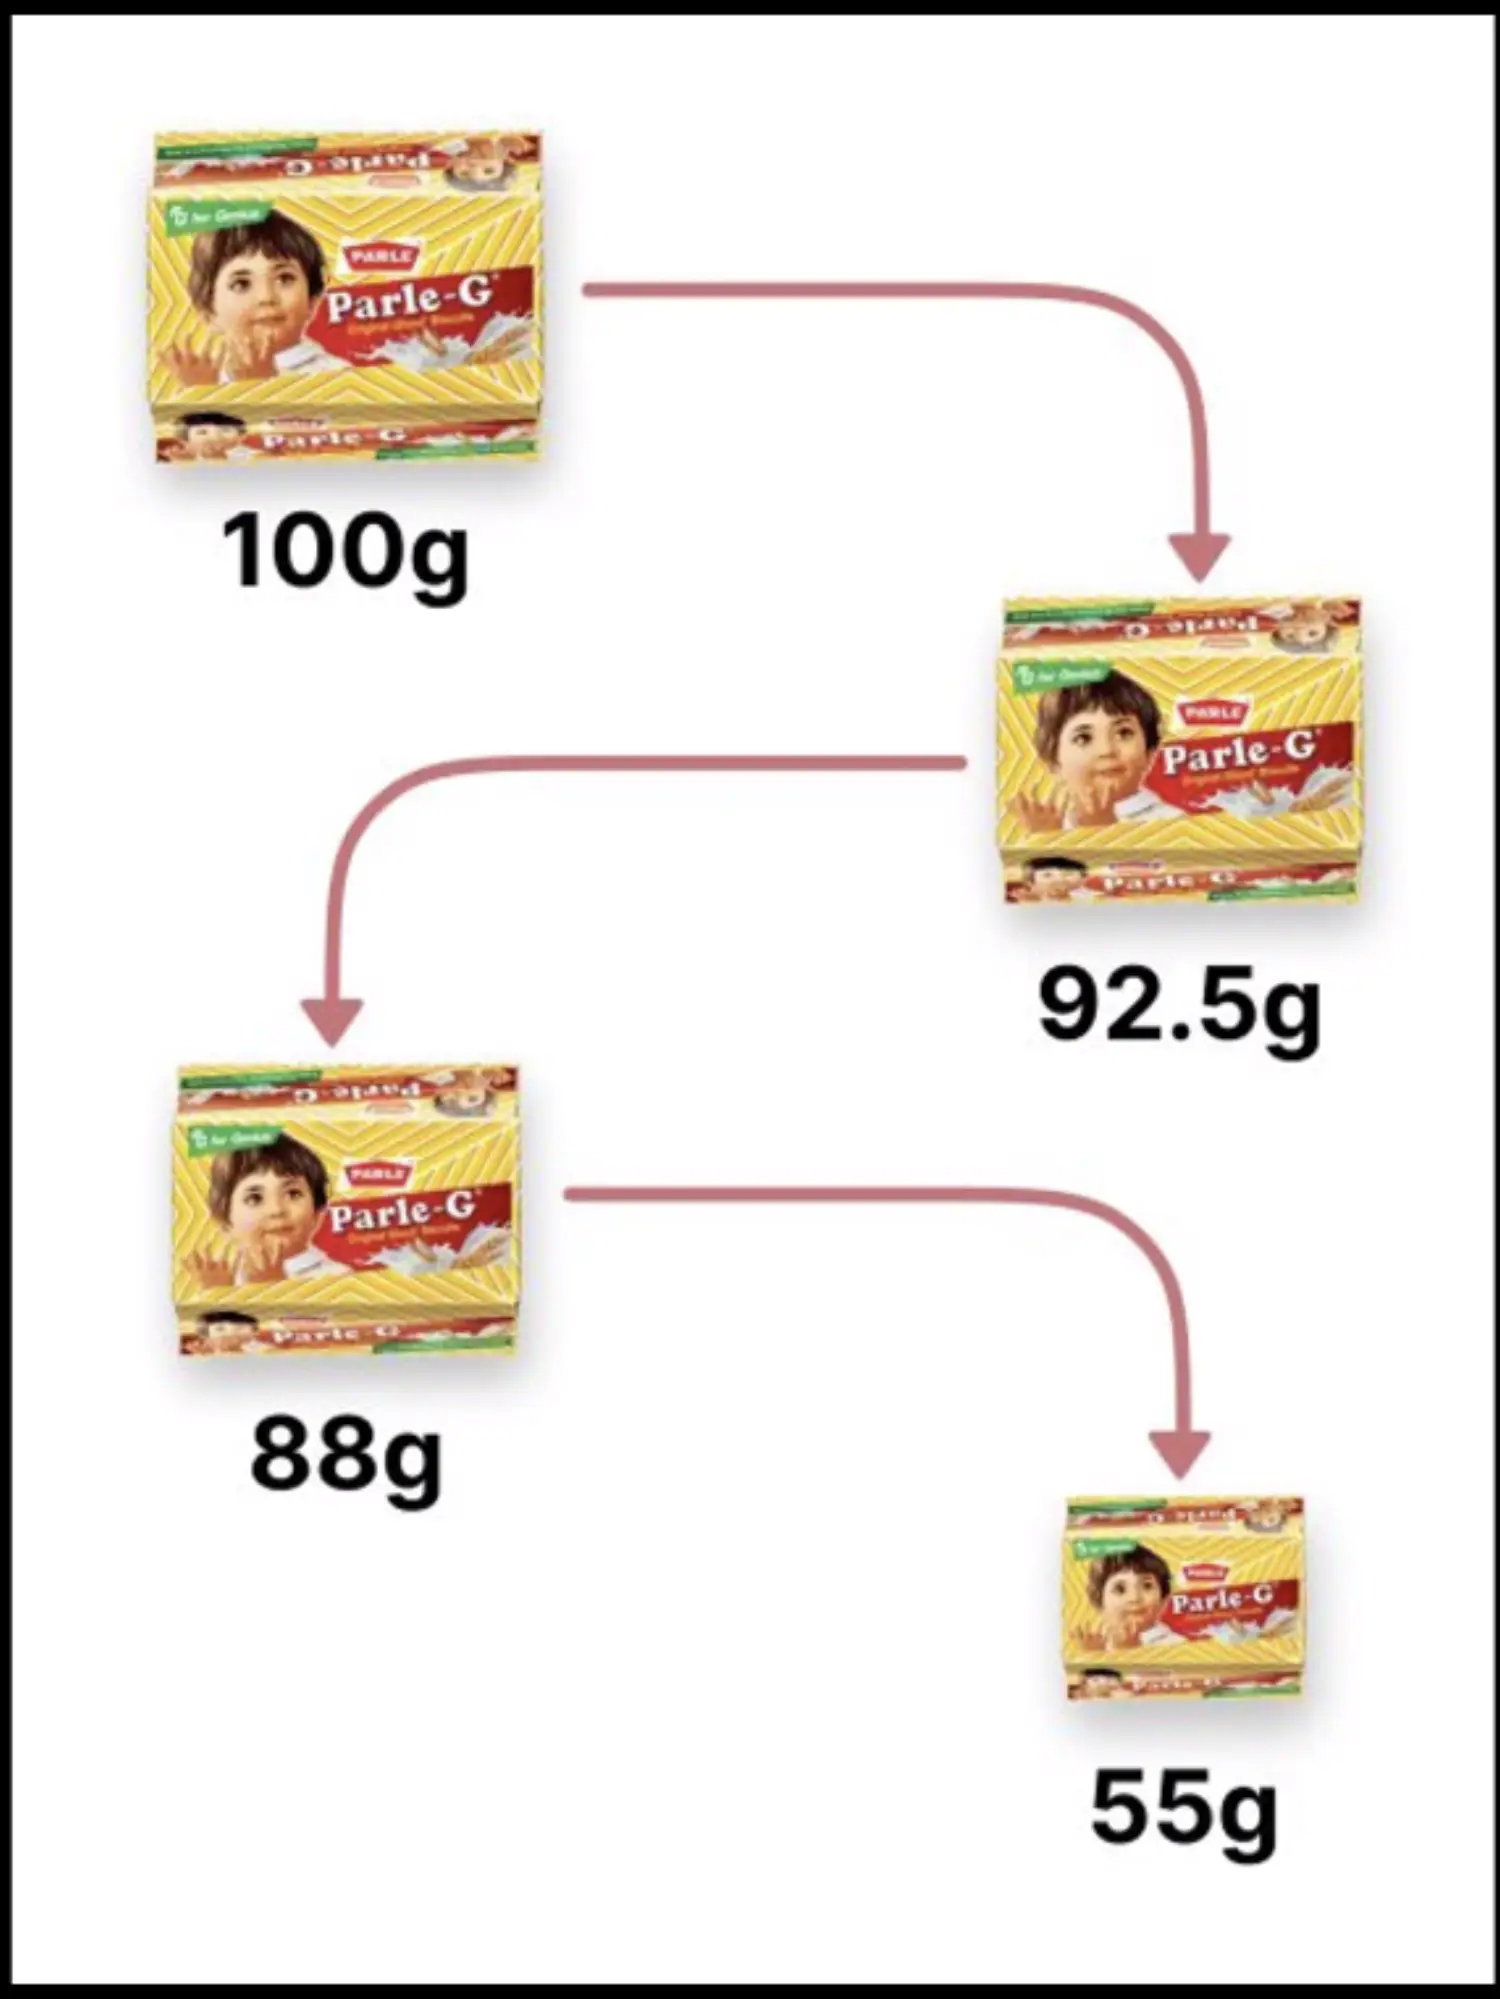
Shrinkflation: Reducing the Quantity being Given to the Customer
Causes of Inflation
It is caused due to Demand Supply Mismatch
Price could increase due to - Two Independent Reasons
Demand for Apple Increases → Demand Pull Inflation
Supply of Apple Decreases → Supply Side Inflation / Cost Push Inflation
If Demand Increased & Supply Decreased → Look Which one is the Dominant Factor
Hence, If Demand Increases by 20% or Supply Reduces by 10% - It will be called as Demand Pull Inflation
Also, If Demand Increases by 10% or Supply Reduces by 20% - It will be called as Cost Push Inflation
Factors that can lead to Increase in Demand in Indian Economy
- Lower RoI → Injected Money in Indian Economy by RBI → Recession Based Injection
- A Condition where a Demand of a Commodity Increases because of Its Need
- Price of Commodity may increase in Future
- Increase in Number of Consumer or Increase in Population
- Borrows More Money → Higher Fiscal Deficit → Money Circulation in Economy Increases
- Increased Salary of People
What Happens when Export Increases - Is it Demand Side or Supply Side Inflation ?
It will lead to Demand Pull Inflation in India
It will lead to Cost Push Inflation as well, where the Supply in India will decrease
In UPSC Mark it as: Demand Pull Inflation
Aggregate Demand
- PFCE → Private Final Consumption Expenditure
- GFCE → Government Final Consumption Expenditure
- GCF → Over All Investment in an Economy
- Net Exports → Total Exports from India - Total Imports into India
Since Export is Part of Aggregate Demand in an Economy, According to Keynes it's a part of Demand Pull Inflation
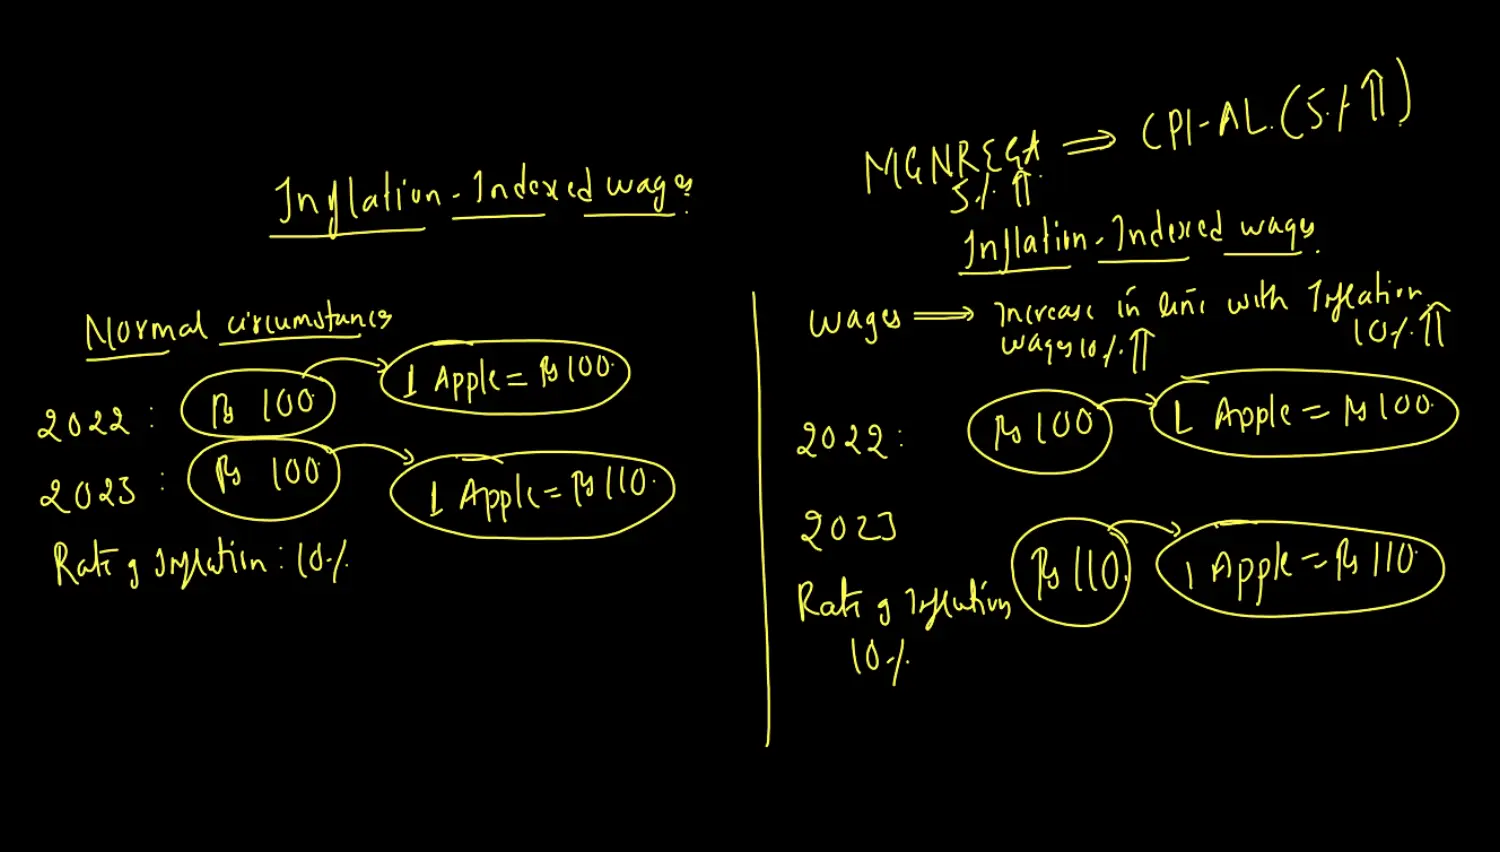
Inflation Index Wages
CPI AL - Consumer Price Index - Agriculture Labour
Demand Only Increases with Surplus Money. Hence in case of Inflation Index Wages there is increase in the Income but it is not surplus as the prices of Goods & Services have increased by the Same Margin
Now, When Labour Cost is Increasing → Cost Push Inflation
Factors Contributing to Inflation - Demand Side / Supply Side
Demand Side and Supply Side Factors
Higher GDP - High Income Level - More Surplus - More Demand
Protein Based Inflation
Farmers Generally Produce - rice & wheat
but due to increase in Per Capita Income - People want more Protein Based Food
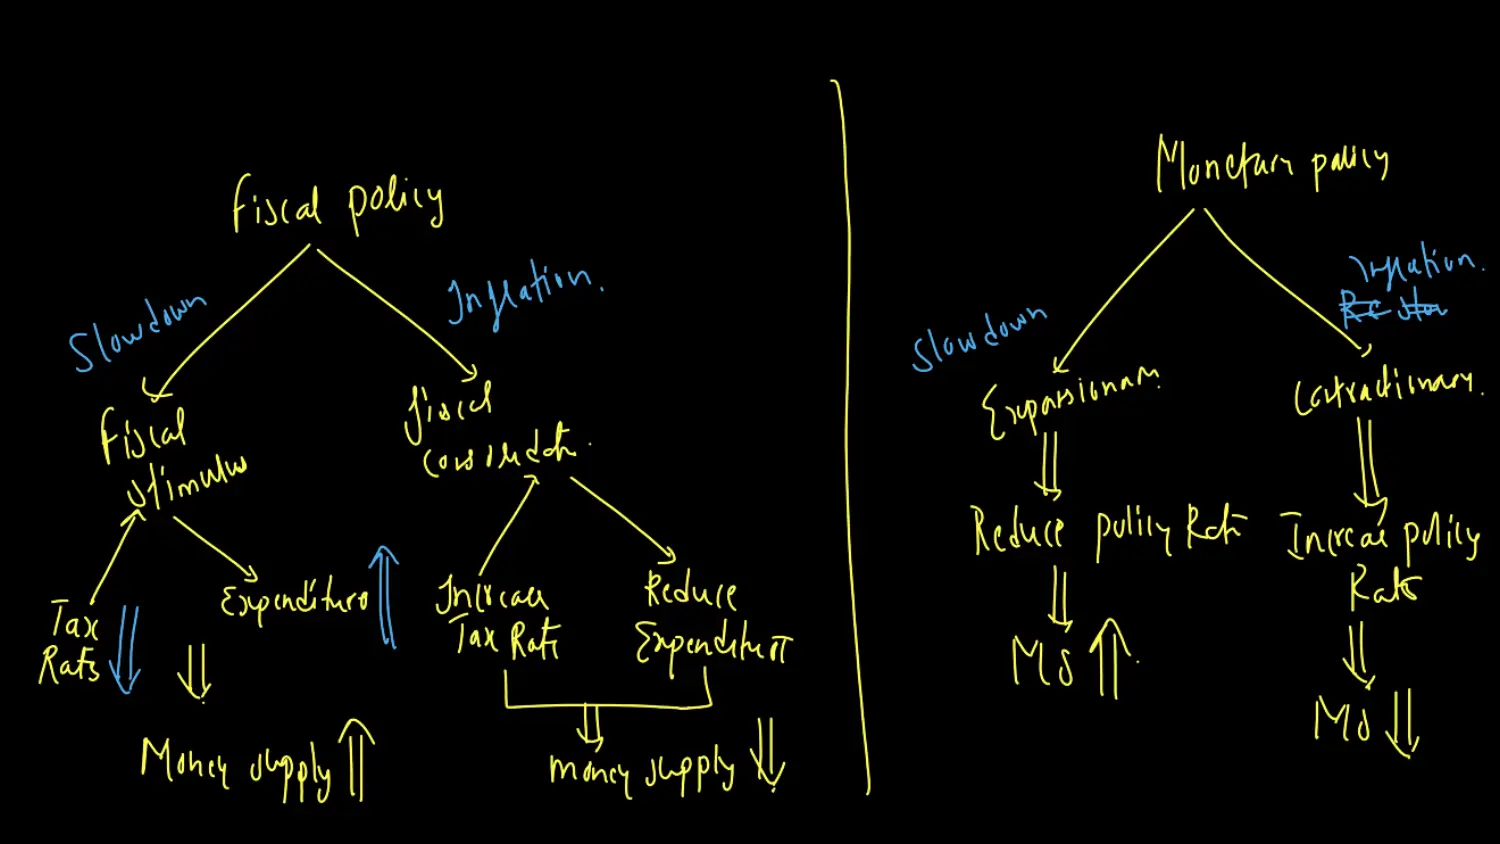
Types of Fiscal and Monetary Policy
Fiscal Policy is the Policy of Government that deals with
- How Much Tax Should it collect - Income
- How Much Should it spend - Expense
Fiscal and Monetary Policy
List of Factors
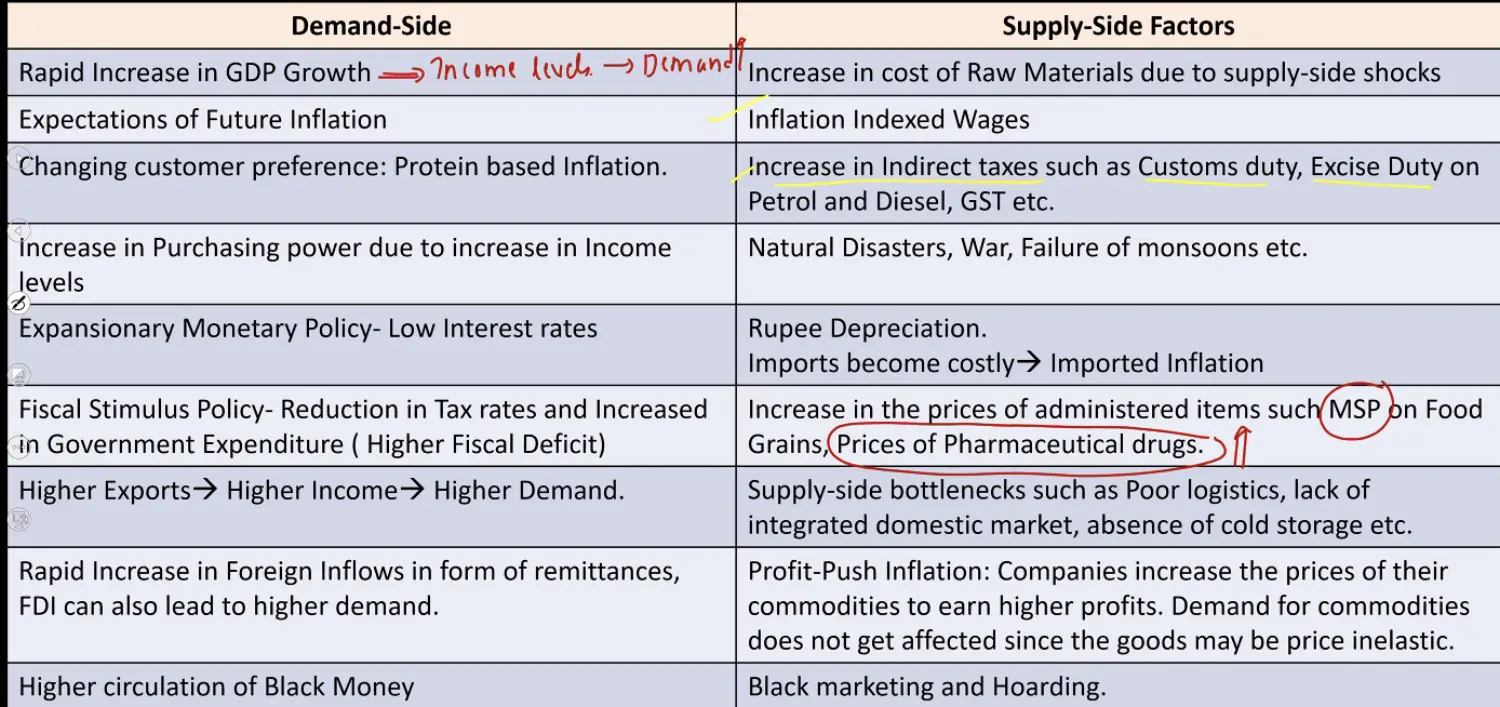
Like in Exports → increase in MSP can lead to Demand Pull & Cost Push Inflation
Dekhna Kaise Hai ki Kaun Sa Inflation Hua Hai
- Demand Pull Inflation
- Uska Demand Badha Hai
- Generally Due to Surplus Money or Increased Money Supply
- Cost Push Inflation / Supply Side Inflation →
- Dekho ki Yaa toh Supply Decrease Hui
- Ya toh uska Price Badha Hai
- Demand Pull Inflation
Structural Inflation
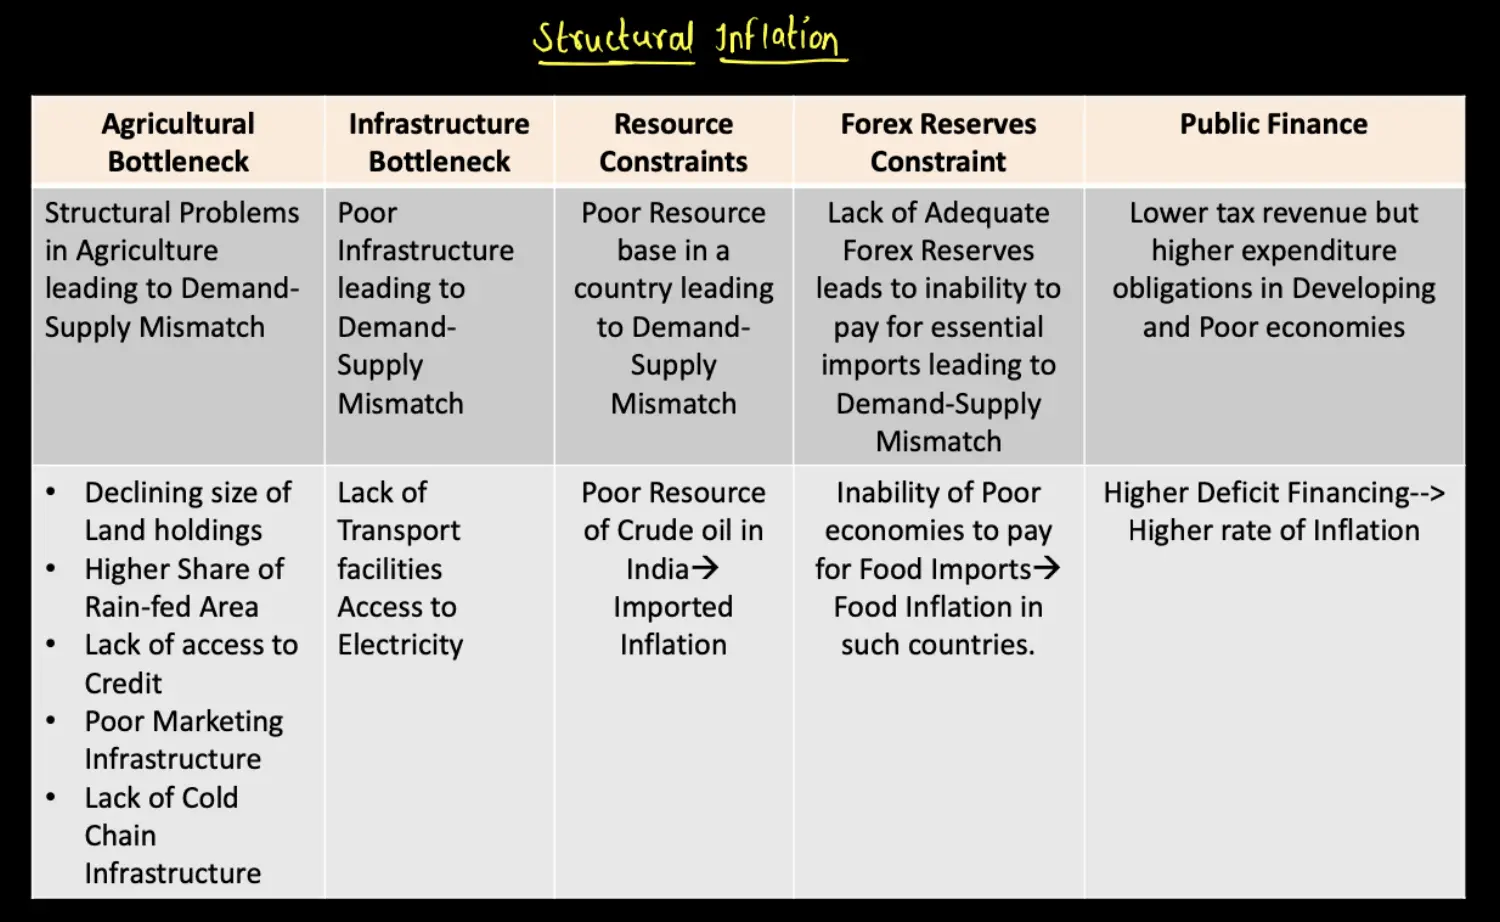
- It occurs due to certain structural deficiency of the economy. this deficiency can be due to both or either of demand or supply side
- For Example Structural Deficiency in Indian Agri is
- Protein Based Inflation
- Rain Fed Agriculture (52% Dependence)
- Poor Storage Infra - Like Godowns & Poor Infra
- Fragmented Land Holdings - 86% Small & Marginal Farmers
- Some Common Structural Deficiencies in an Economy
Dominance of Monopolistic Companies in an Economy
Poor Logistics
Lack of Adequate Forex Reserve
Example: Pakistan, Bangladesh & Sri Lanka
Problem wrt Public Finance
Poor & Developing Companies - Revenue Lower & Expenditure Higher → Increased Government Borrowing → Higher Fiscal Deficit → Borrow More → More Money in Economy Injected by Govt → Creates Conducive Env for Pvt Sectors and Other Investments → Thus Increasing the Crowding Effect
Lack of Natural Resources
Lack of Human Capital or Old Human Capital
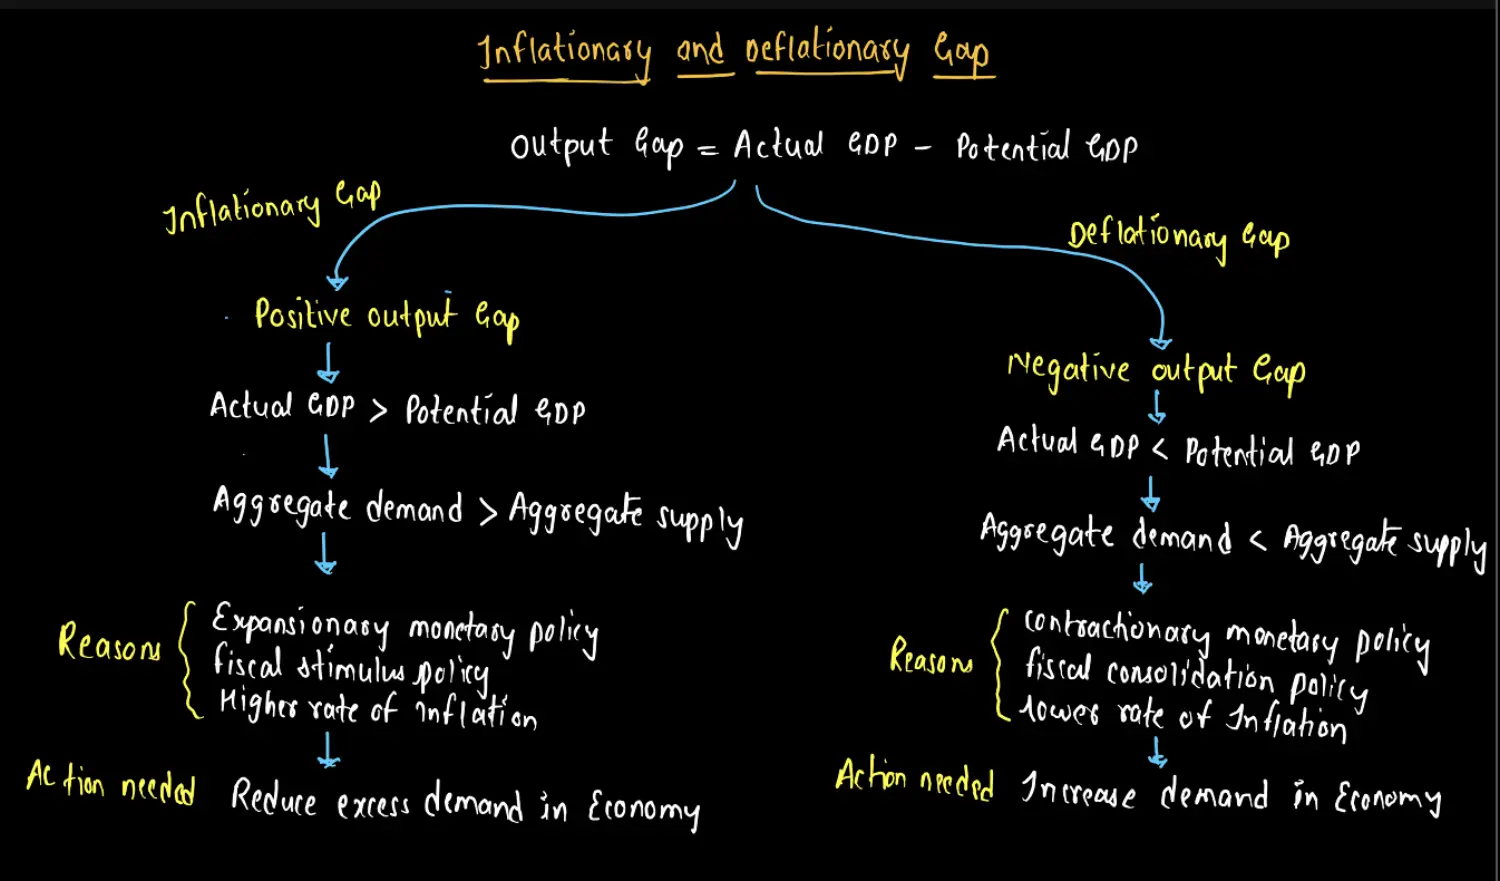
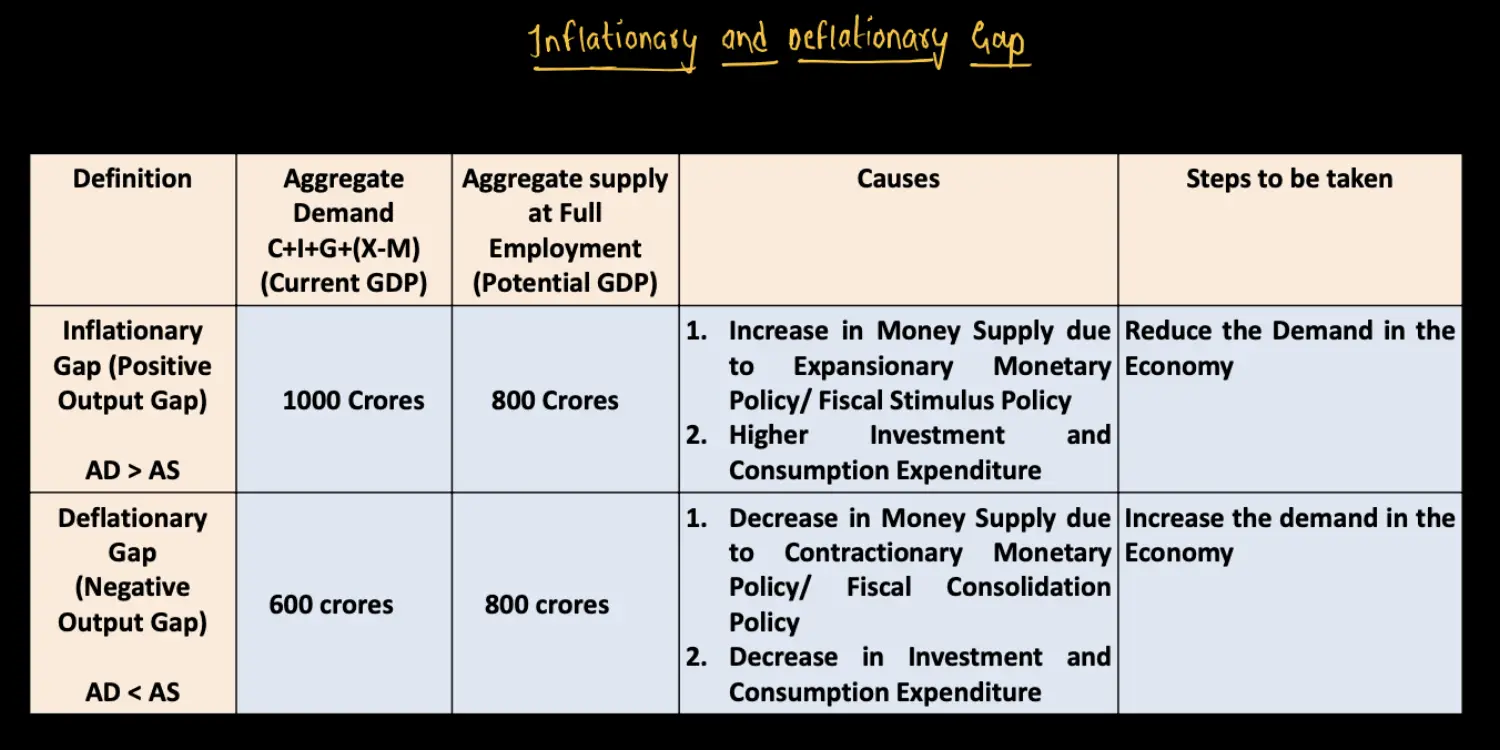
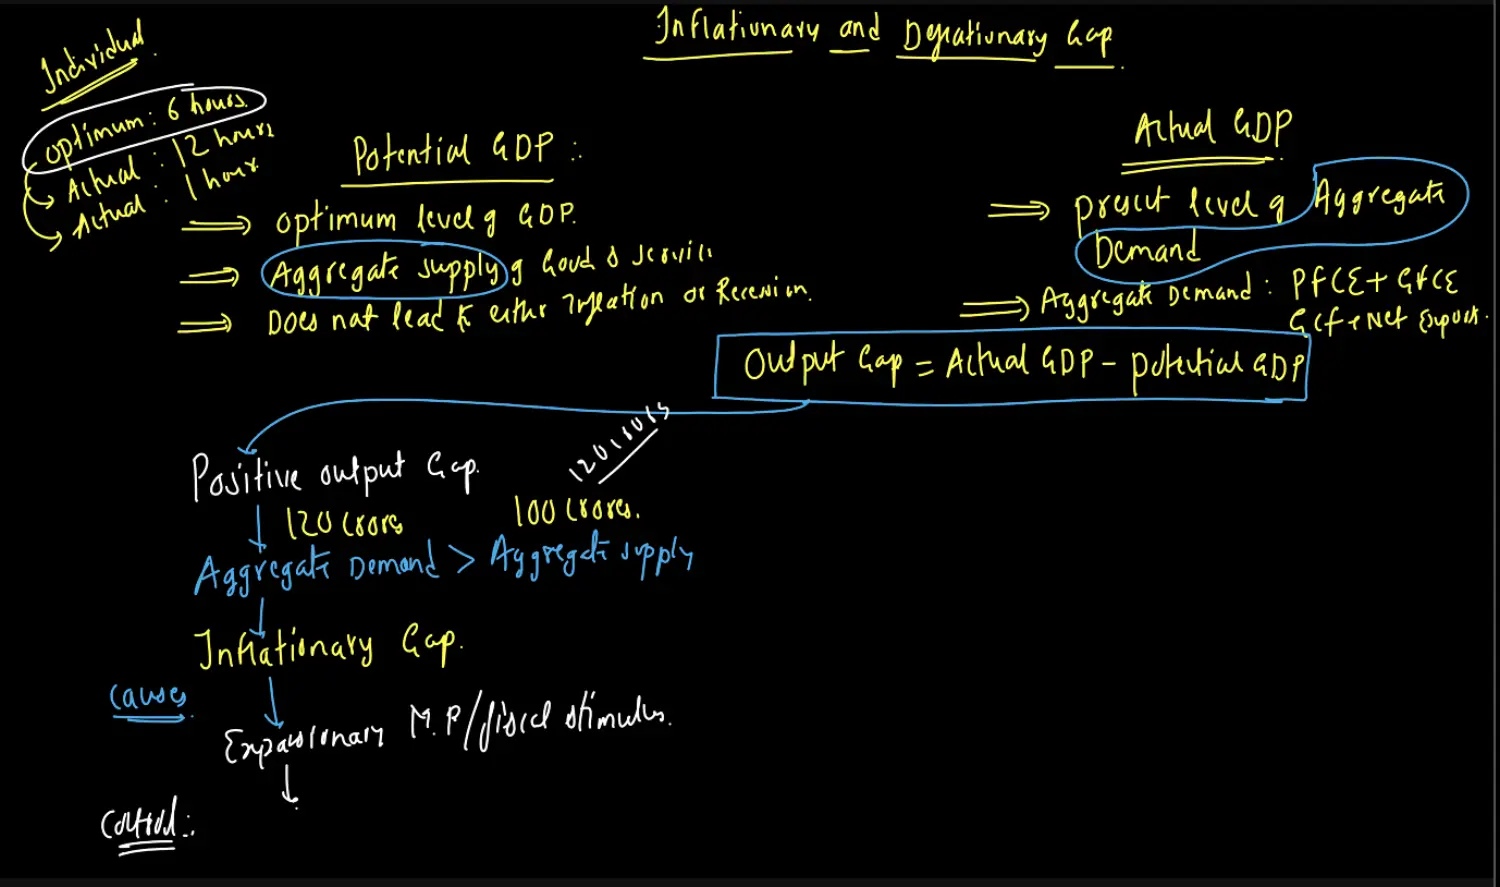
Inflationary & Deflationary Gap
💡 **Supply** Pe Control Nahi Hota Hai → Isliye **Demand** pe Control Karte HainHence, We Can't Increase the Aggregate Supply
Measurement of Inflation in India
Basket of Commodities
- Inflation is always measured in a Basket of Commodities
- This Basket of Commodity is fixed by the Entity which is Publishing this Index
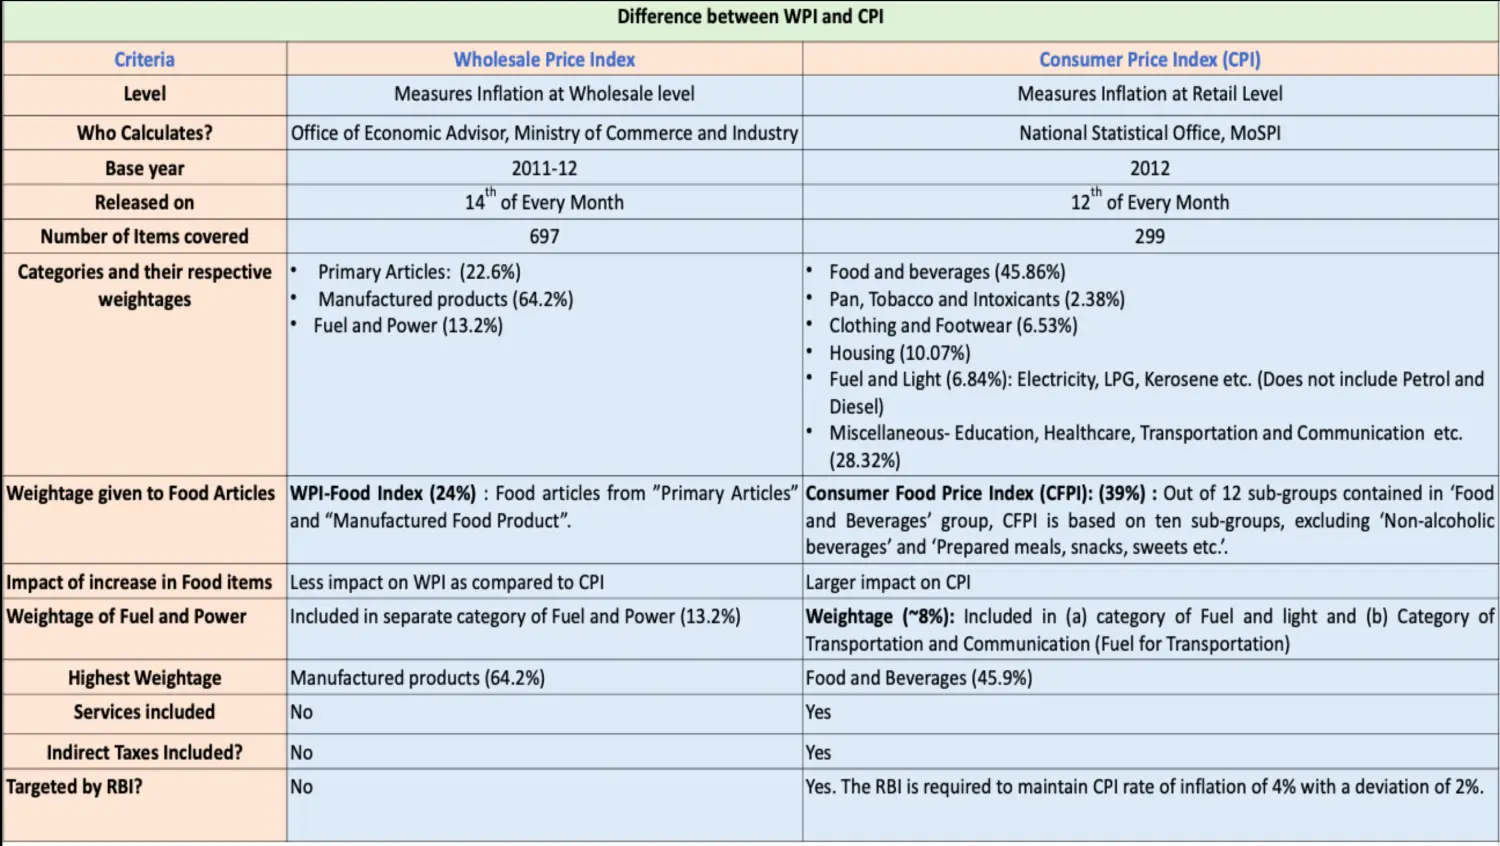
- WPI - Office of Economic Advisor, Ministry of Commerce & Industry → 697 Commodities
- CPI - National Statistics Office, Under Ministry of Statistics → 299 Commodities
Weightage
- Commodities which have recurring demand have more weightage in calculation
- As Compared to Refrigerator and Apple. Apple has more weightage as it has more recurring demand
- All the Weightages are assigned as such that it is total to 100
Base Year
- The Year in Which Prices of Commodity were Relatively Stable like in 2012 for WPI
- Prior to 2012, the Base Year was 2004-05
- The Frequency at which it changes is decided by the agency which publishes it
- No Fixed Limit of time for change
Laspeyres Formula → Relative Price & Rate of Inflation → For Both WPI & CPI
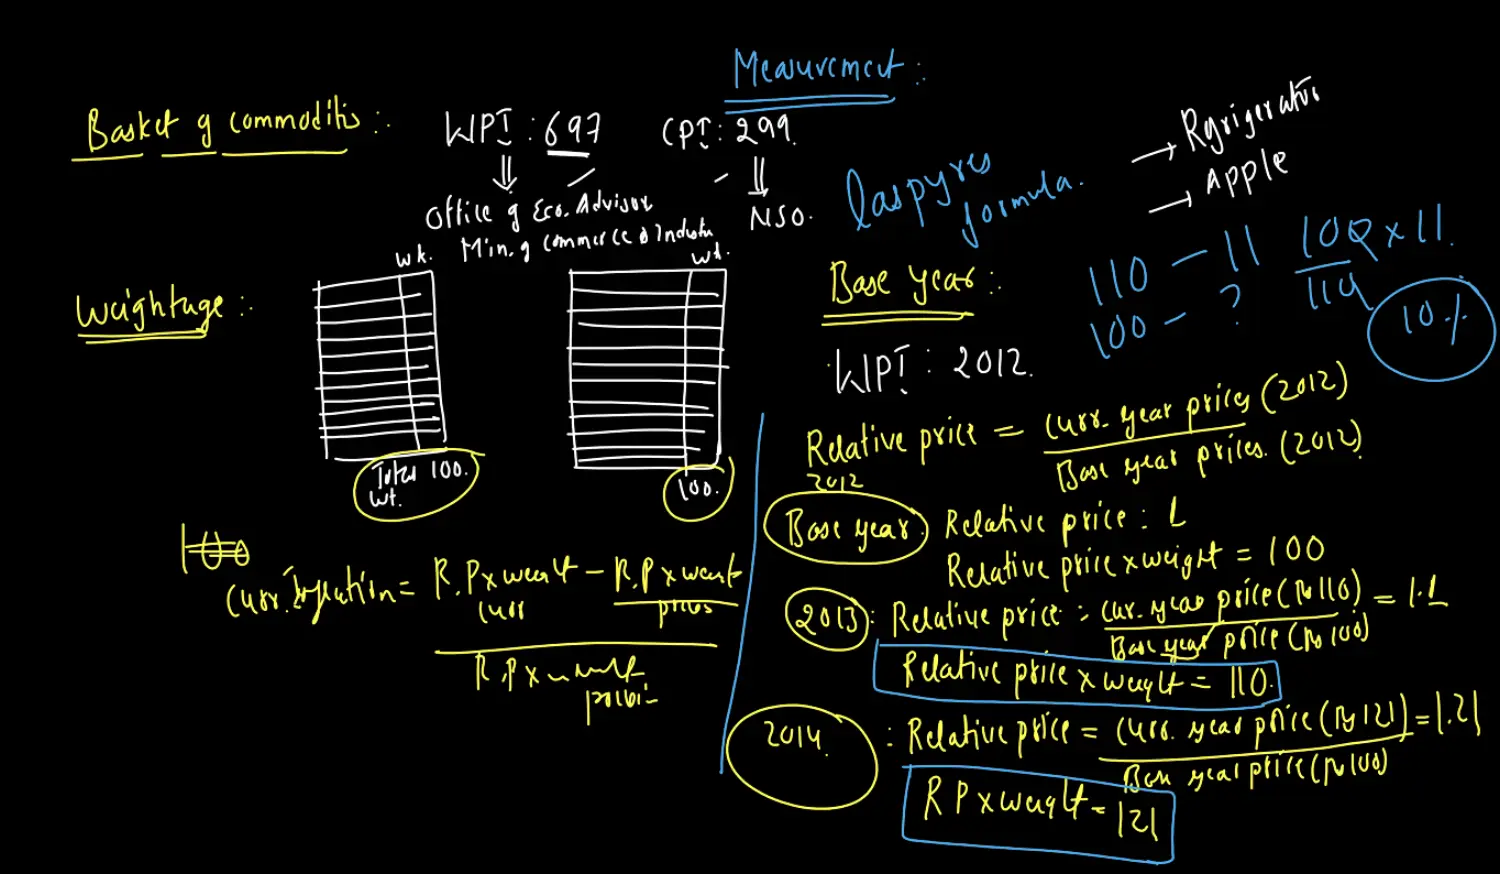
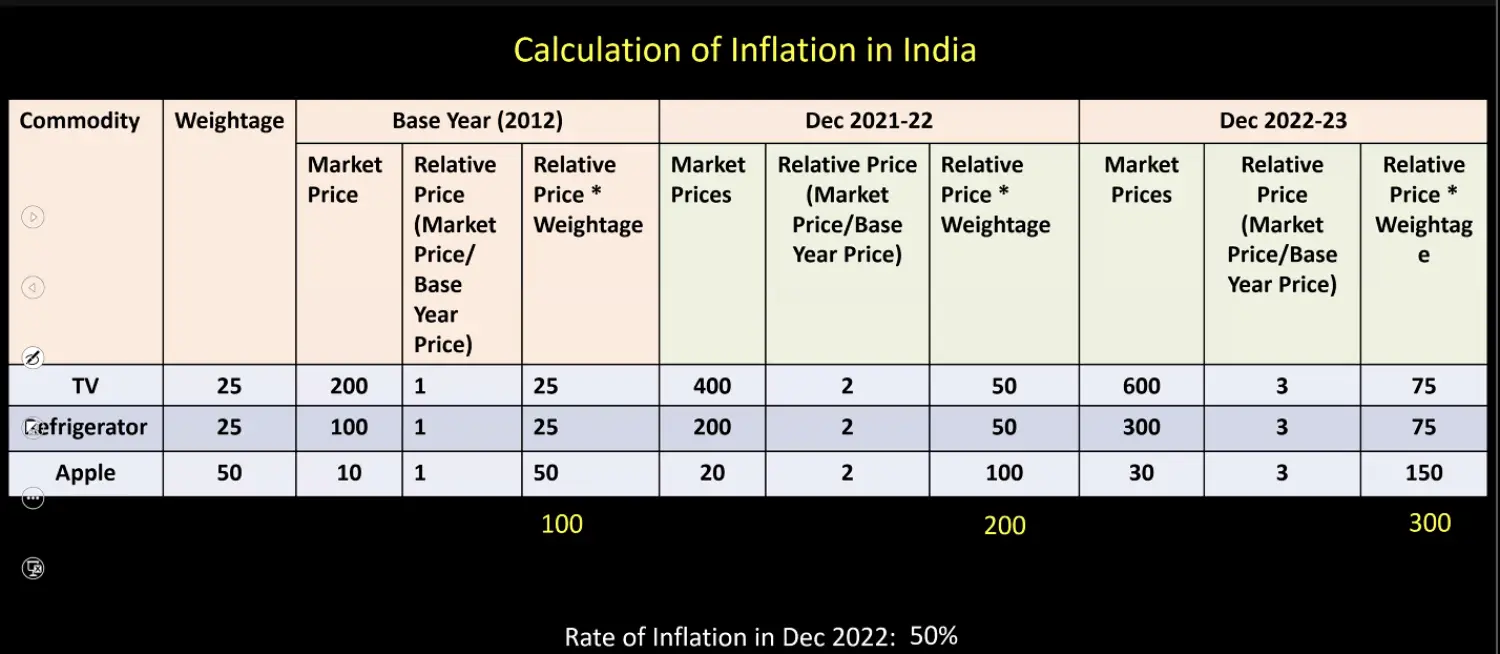
Formula: Relative Price = Current Year Prices / Base Year Prices
Rate of Inflation
Rate of Inflation = { (RP of Current Year - RP of Previous Year) / RP of Previous Year }* 100
For Base Year 2012
Relative Price for Base Year will be 1
Relative Price * Weight = 1 * 100 = 100
For Year 2013
Relative Price = Current Year Price (Rs 110) / Base Year Price (Rs 100) = 1.1
Relative Price * Weight = 1.1 * 100 = 110
Here Inflation is → 110 - 100 * 100 = 10
For Year 2014
Relative Price = Current Year Price (Rs 121) / Base Year Price (Rs 100) = 1.21
Relative Price * Weight = 1.21 * 100 = 121
Here Inflation is → 121 - 110 * 100 = 10
Important Note
💡 Relative Price is Measured wrt Base Year Rate of Inflation is Measured wrt the Previous Year
Types of Measurement of Inflation - PPI, WPI, CPI
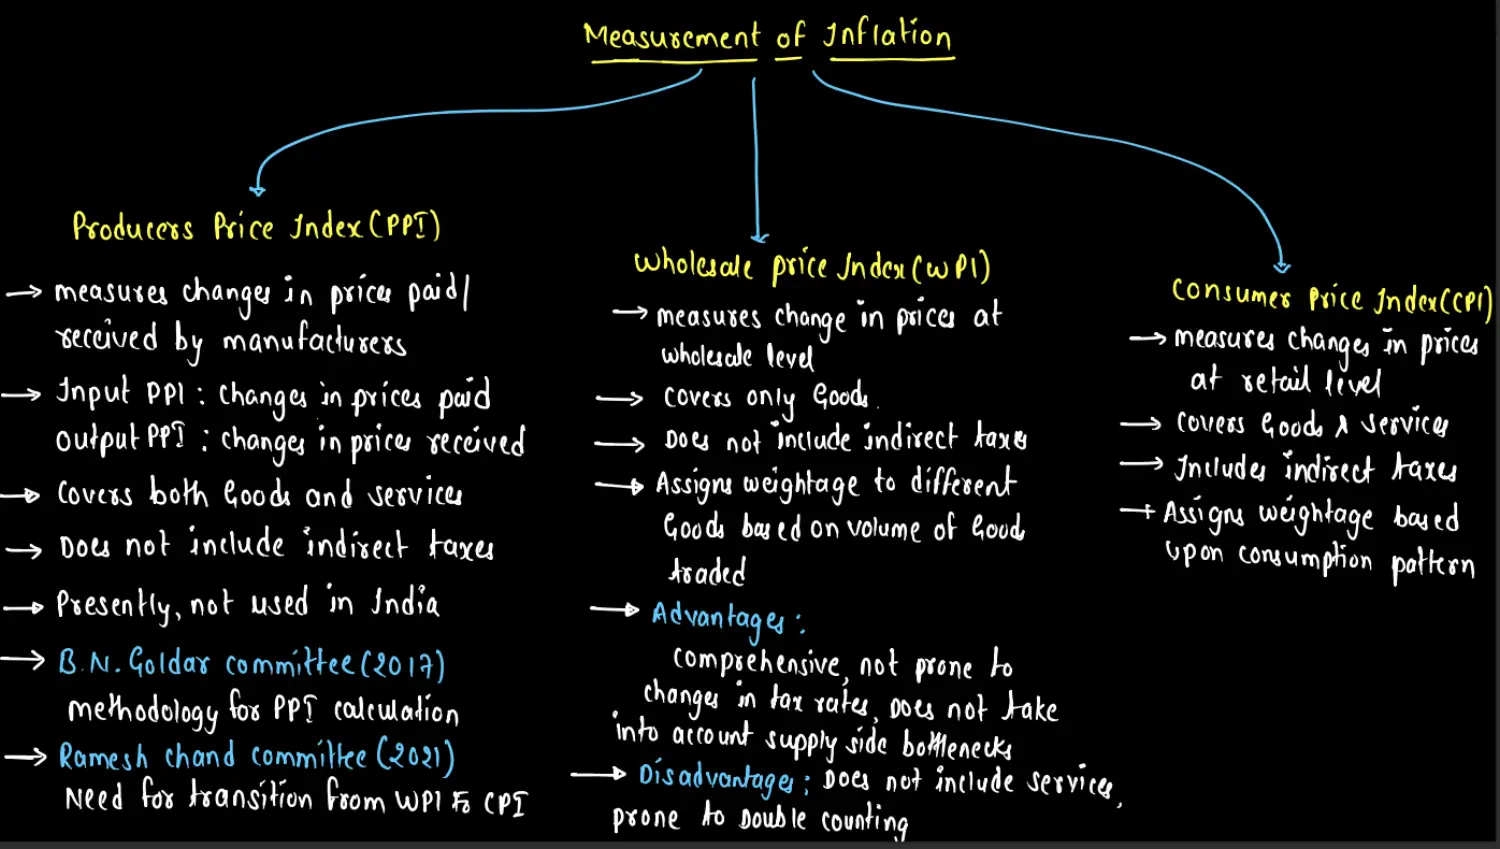
PPI
Paid By : Change in cost of Raw Material for a Producer : Input PPI
Received By : Change in Selling Price for Producer : Output PPI
Chand Committee : Transition from WPI to PPI
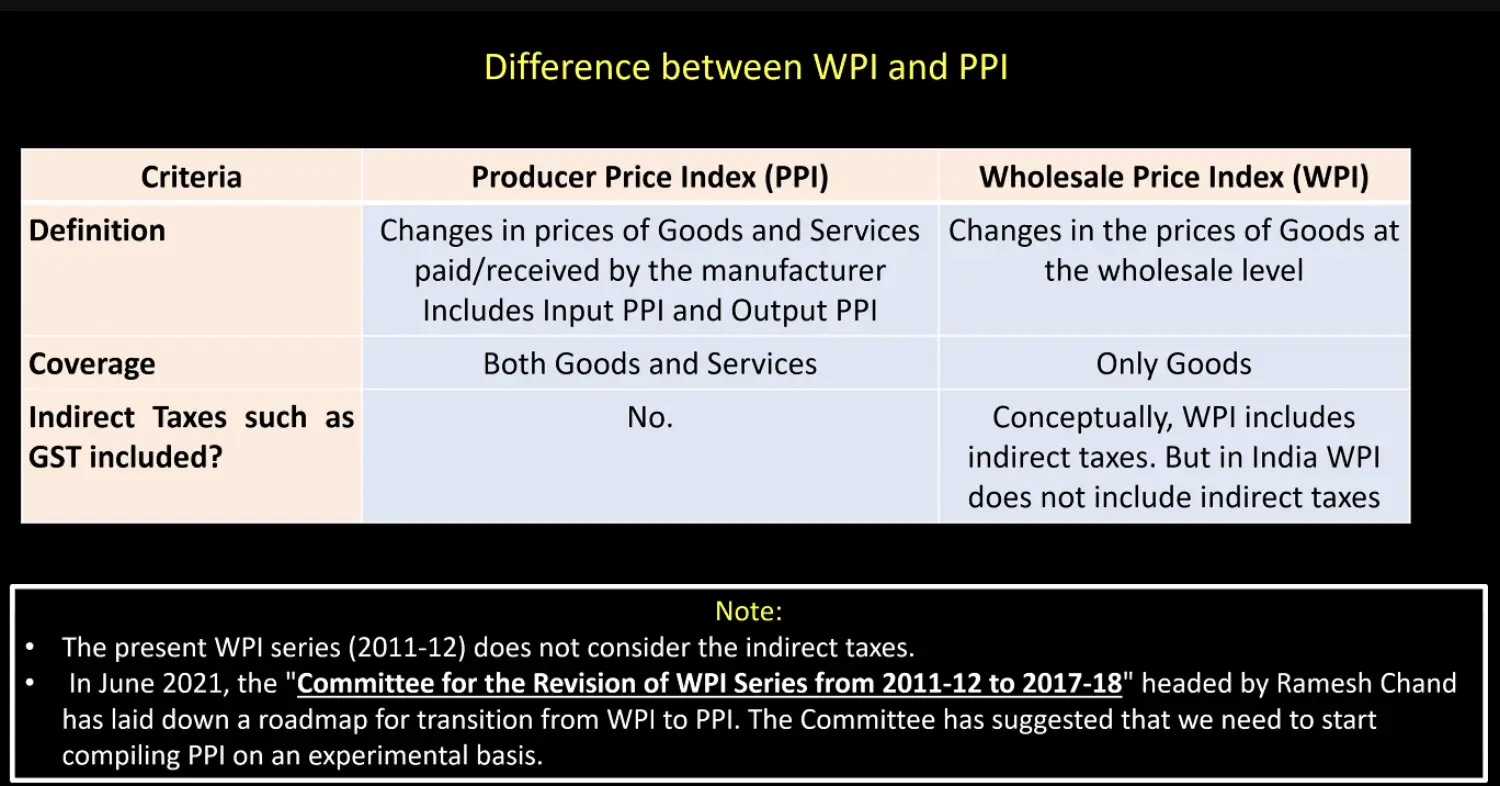
Indirect Taxes : Example is GST
Service is Always at Retail Level and Not at Wholesale Level, Isliye WPI main Included Nahin Hai Services
WPI - By Economic Adviser in the Ministry of Commerce and Industry
Pros
- Comprehensive as it has 697 Items
- No Indirect Tax Included
Cons
- Does Not Cover Service - Service is 55% of GDP
- Leads to Double Accounting → Product counted as a Primary Item (Orange) is also included in Manufactured Product (Orange Juice)
CPI - By The National Statistical Office (NSO), Ministry of Statistics and Programme Implementation (MoSPI)
It is Targeted by RBI
Difference Between WPI & PPI
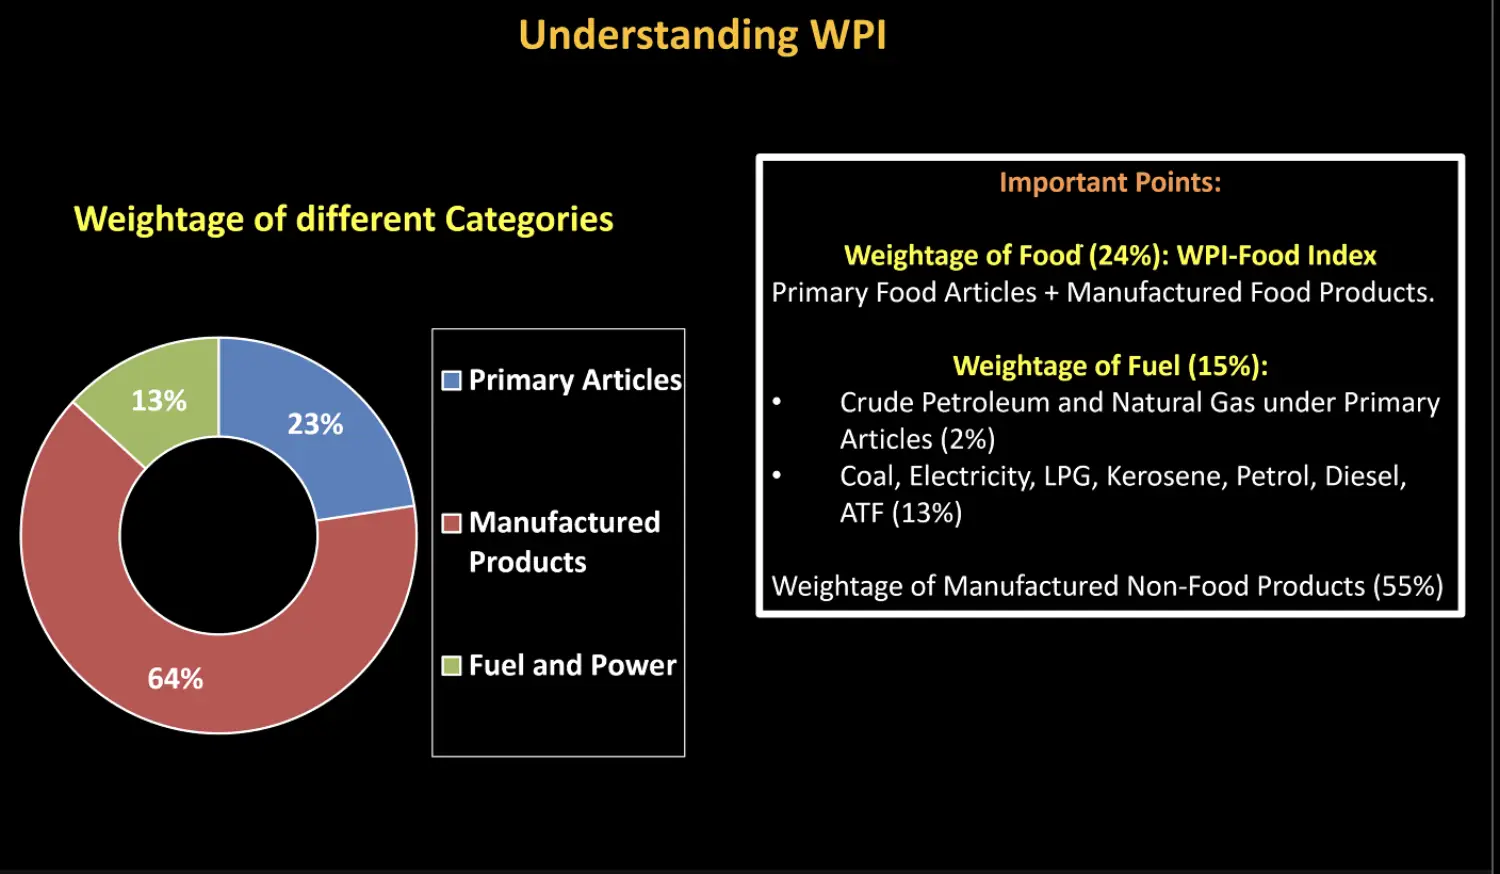
Understanding WPI - 697 Commodities
- Published by Office of Economic Advisor from Ministry of Commerce & Industry on Monthly Basis
- WPI is Pub wrt to month of Previous Year
- Components of WPI
- Primary Food Articles - Grains
- Primary Non Food Article
- Raw Materials for Industry
- Crude Petroleum and Natural Gas
- Manufactured
- Man Food Prod
- Man Non Food Prod
- Fuel & Power
- Petrol Diesel Electricity
Understanding CPI - 299 Commodities
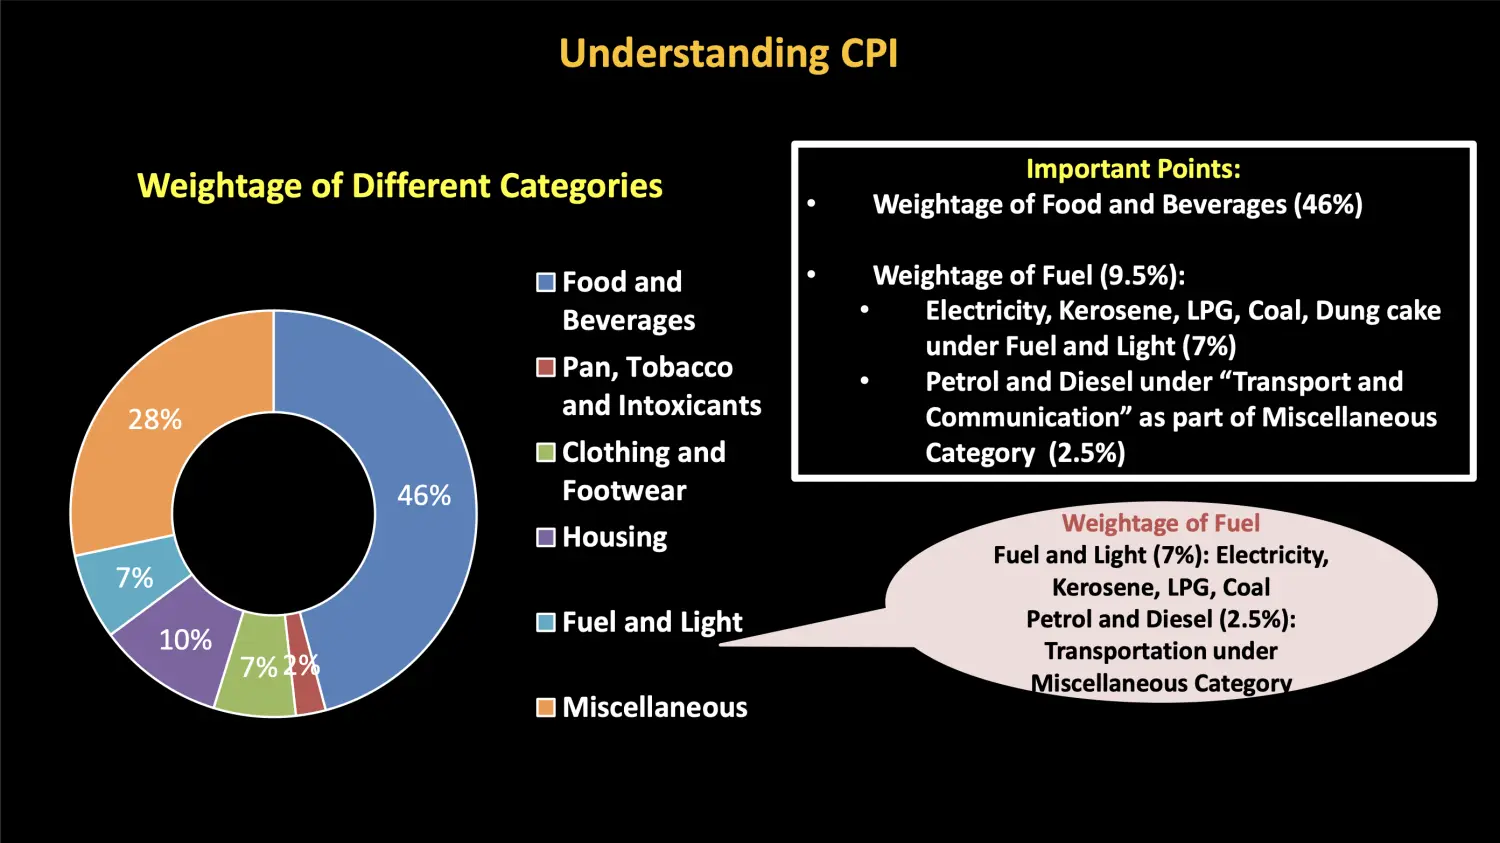
Miscellaneous: Service Like Education, Health, Telecommunication, Transportation ( Including Petrol Diesel)
Note : Fuel and Light Does Not have Petrol and Diesel
Difference Between WPI & CPI
Inflation Expectation is controlled not the Inflation Per Say
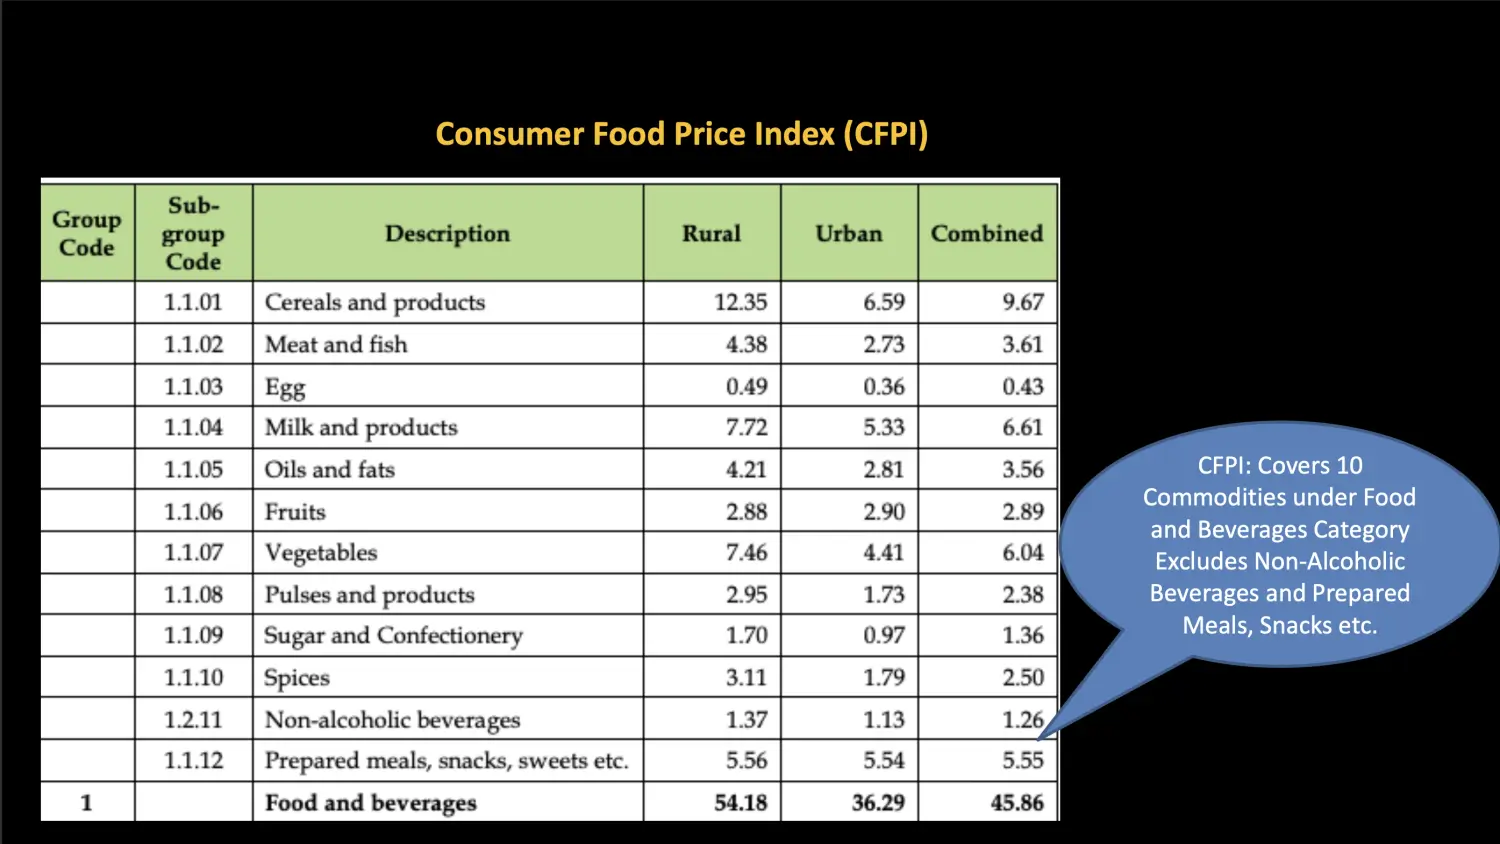
CFPI - Consumer Food Price Index
Covers 10 Commodities Table of Food & beverage - 2 Commodities = Table of CFPI
Types of Inflation - Headline, Core, Refined Core
ONLY FOOD & FUEL is considered to be VOLATILE
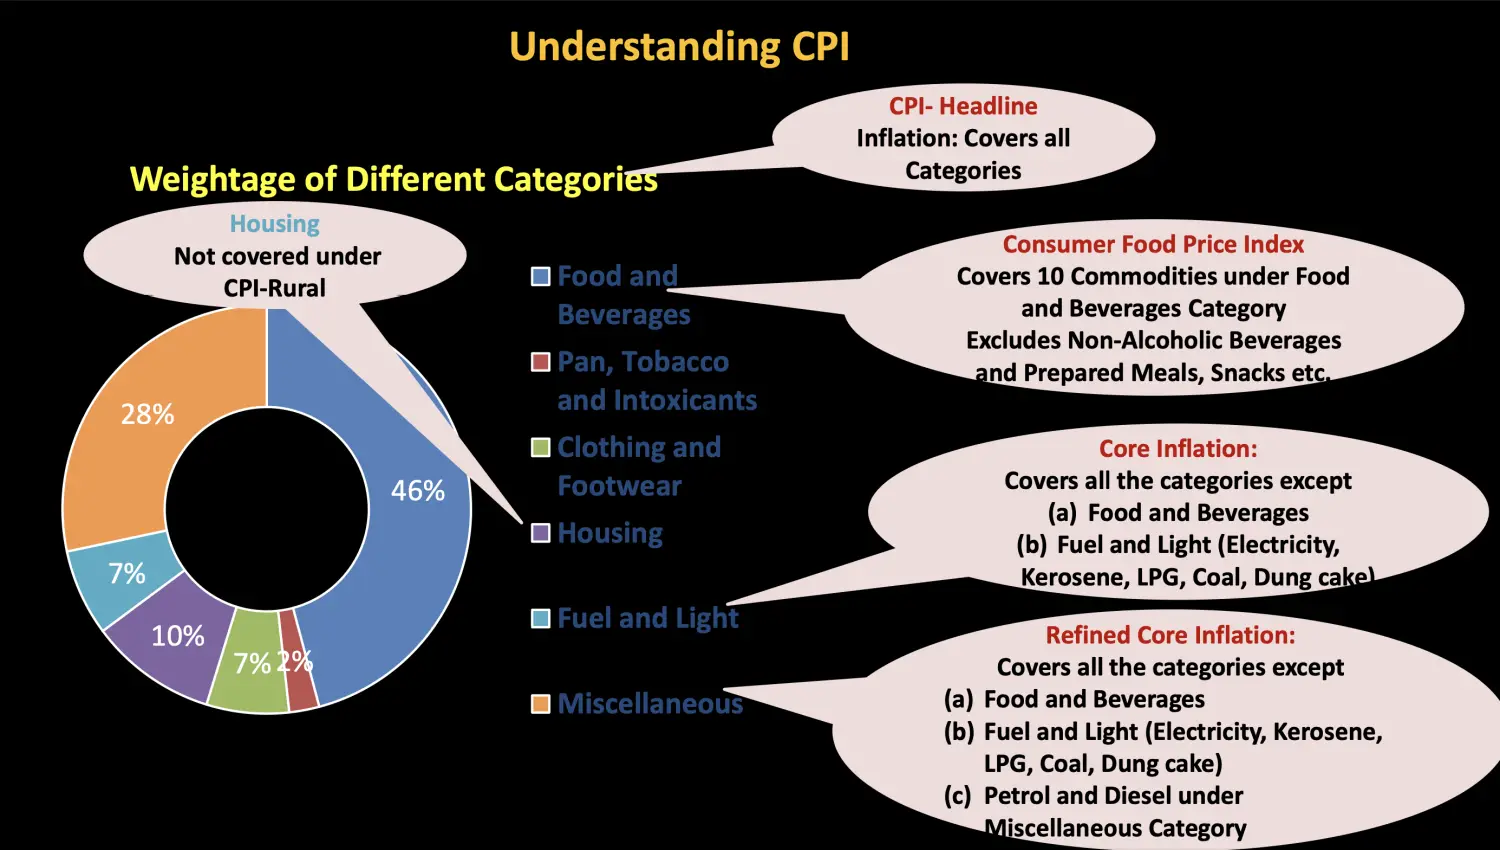
- Headline Inflation
- WPI : All 697 Commodities
- CPI : All 299 Commodities
- If not Said anything, only Headline then CPI
- Core Inflation
- Excludes Volatile Commodities like Food and Fuel
- WPI - Food & Fuel → WPI Core Inflation
- CPI - Food & Fuel → CPI Core Inflation
- Suggestions on Core Inflation should be Targeted by RBI
- Here Miscellaneous Categories is Included
- Refined Core Inflation
- Further Removes Component of Petrol and Diesel from Miscellaneous
- Headline Inflation
Other Varieties of CPI

CPI AL: Agricultural Labour - NREGA is Linked
Mahendra Dev Verman Committee Suggested that MGNREGA Should be Linked to CPI RL Rather than CPI AL
CPI RL: Rural Labour
CPI IW: Industrial Workers → Linked to Inflation INdex Wages → Mehangai Bhatta
CPI Rural: Does not take into account changes in rental prices of housing - as in rural people own houses and don't rent
CPI Urban: Inflation in Urban Areas
CPI Combined: Average of CPI Rural and Urban
Other Types of Indexes
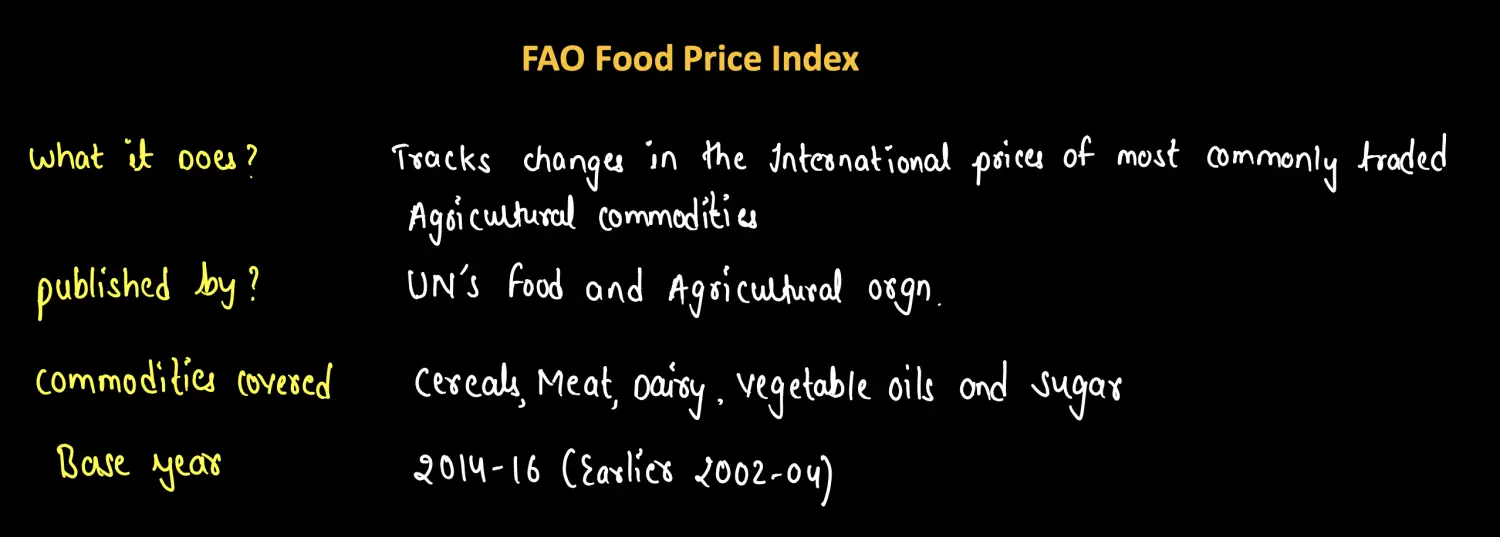
FAO - Food Price Index
International Level → Published by FAO - Food and Agricultural Organisation
Housing Price INdex - By RBI
RESIDEX - by NHB
Understanding Variation in CPI
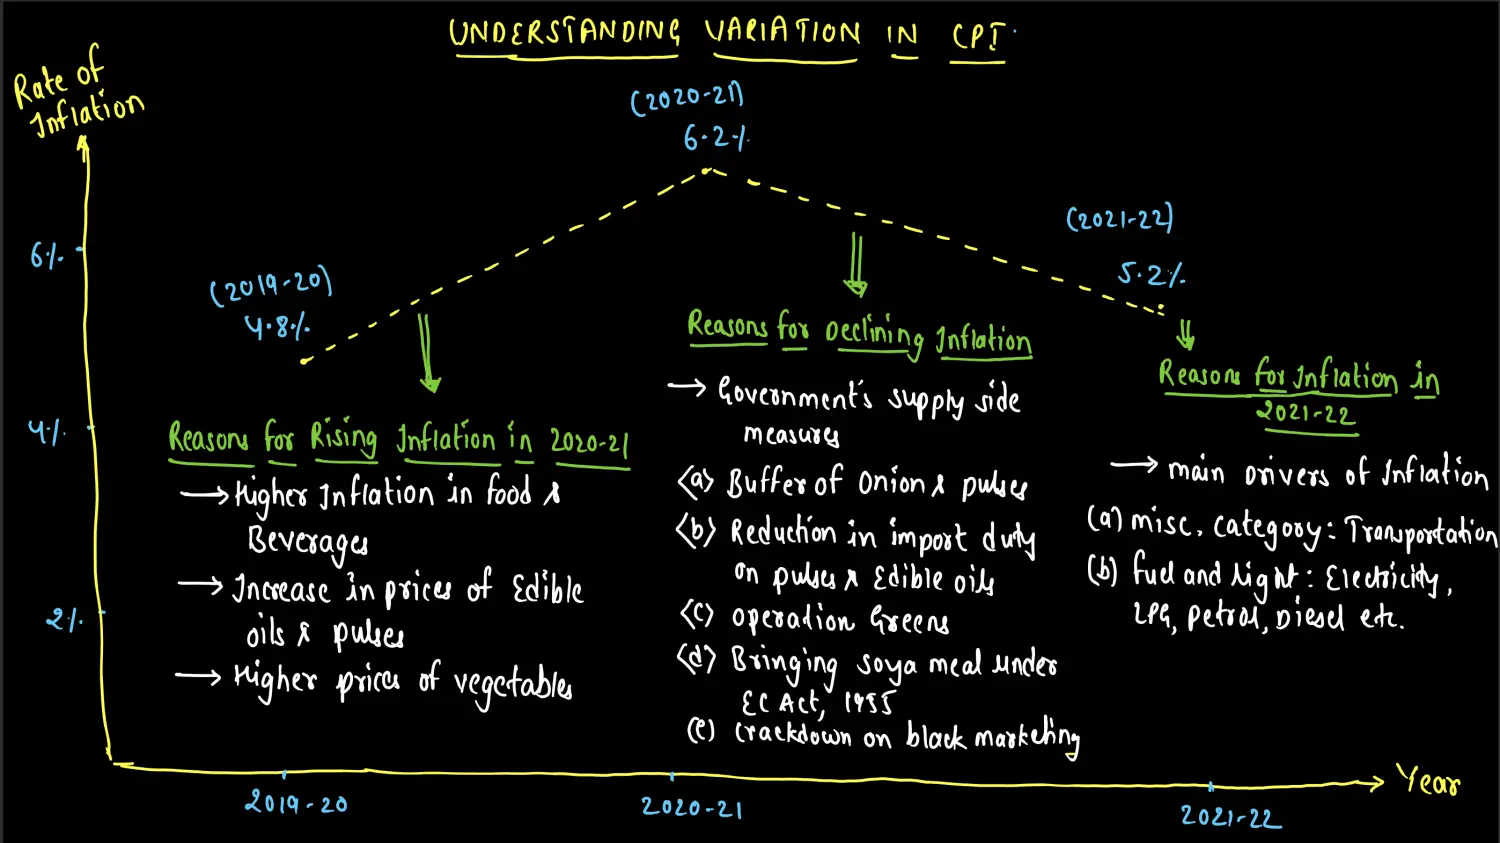
60% of Edible Oil & 99% of Palm Oil is Imported
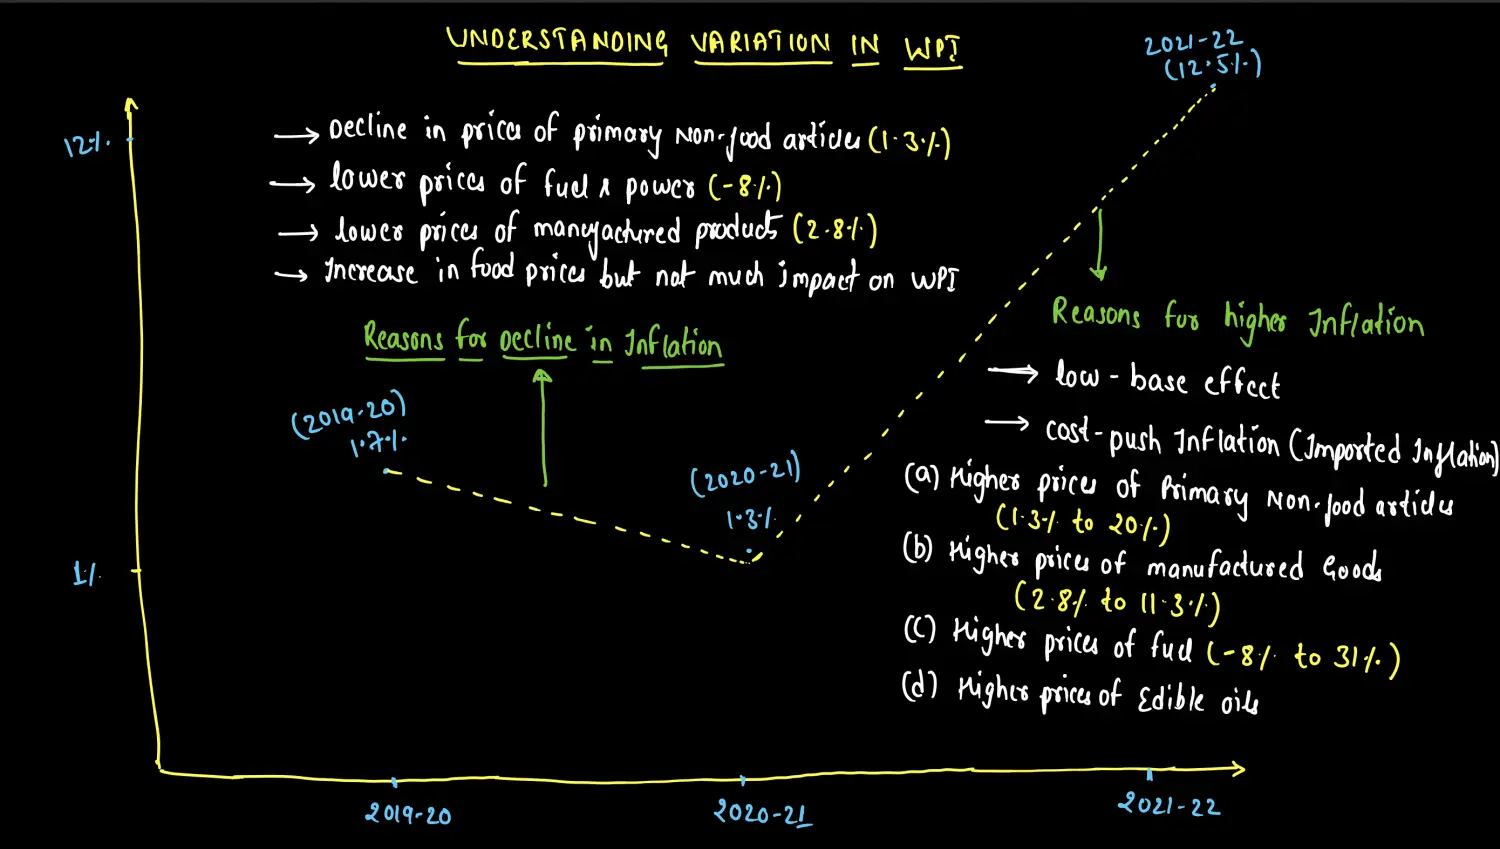
Understanding Variation in WPI
Divergence Between CPI & WPI
- Weightage of food in WPI and CPI
- in WPI - 24%
- in CPI - 45%
- Weightage of Manufactured in WPI and CPI
- in WPI - 55%
- in CPI - Lower than WPI
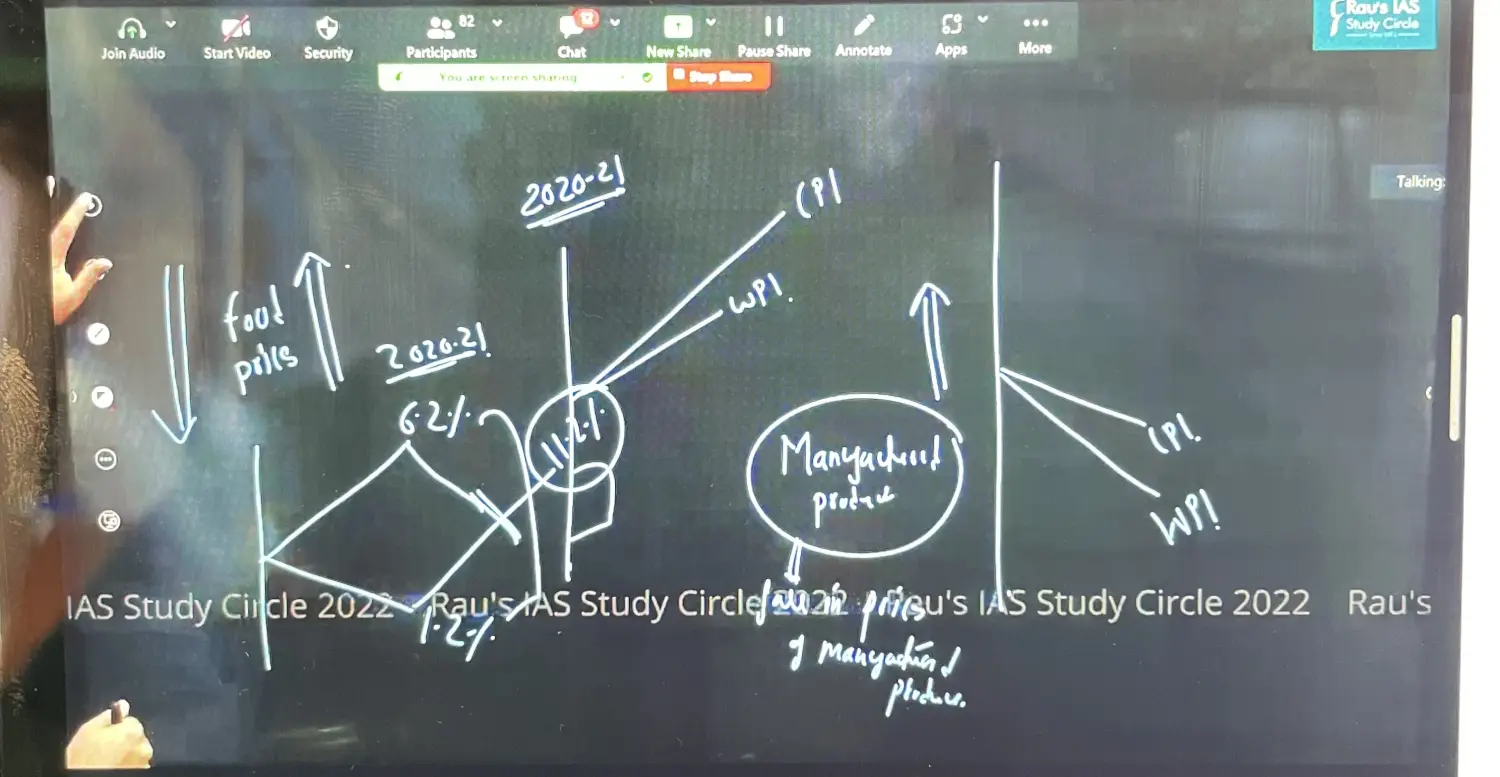
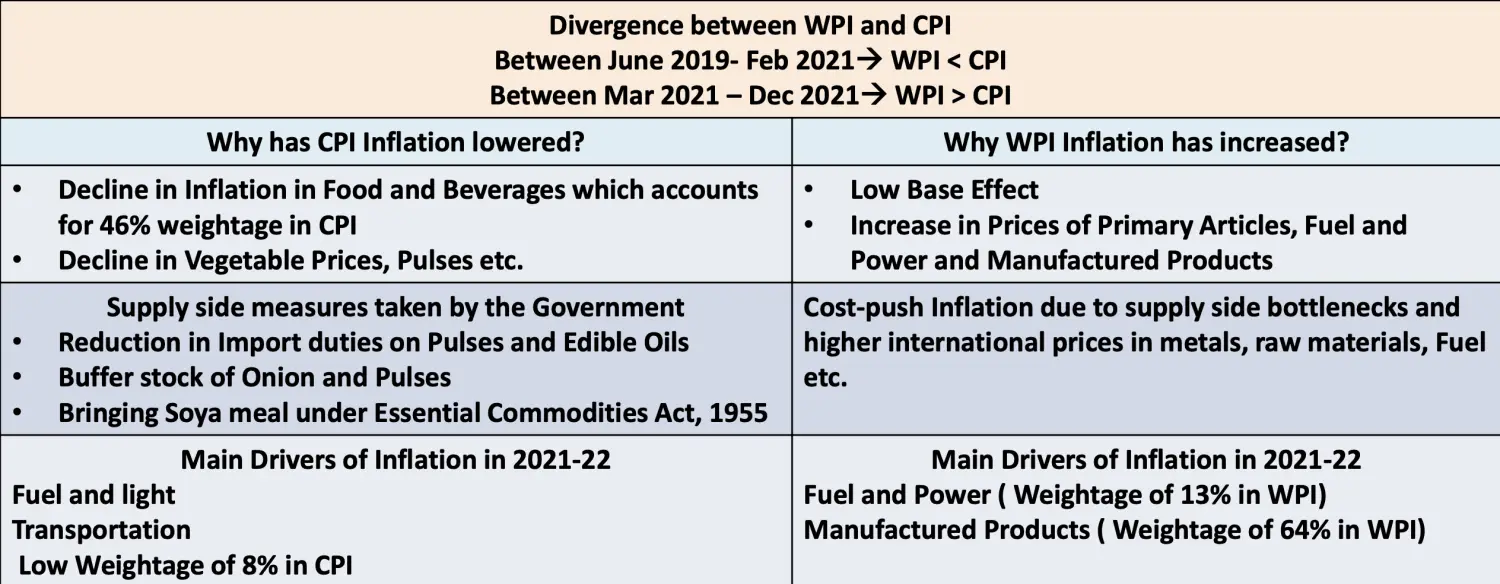
- Weightage of food in WPI and CPI
Concept of GDP Deflator
Nominal GDP and Real GDP
- Nominal GDP - GDP at Current Market Prices
- Real GDP - GDP at Base Year Price or Constant Prices
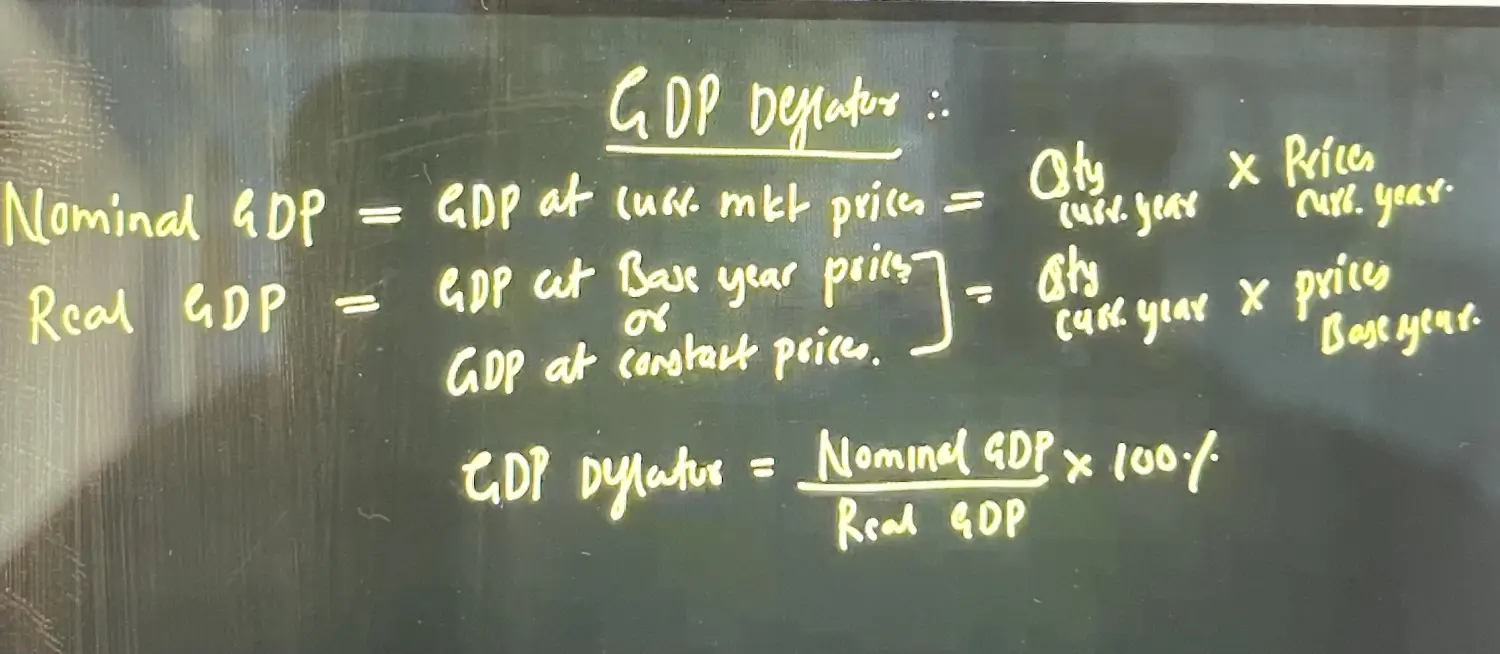
Concept of GDP Deflator
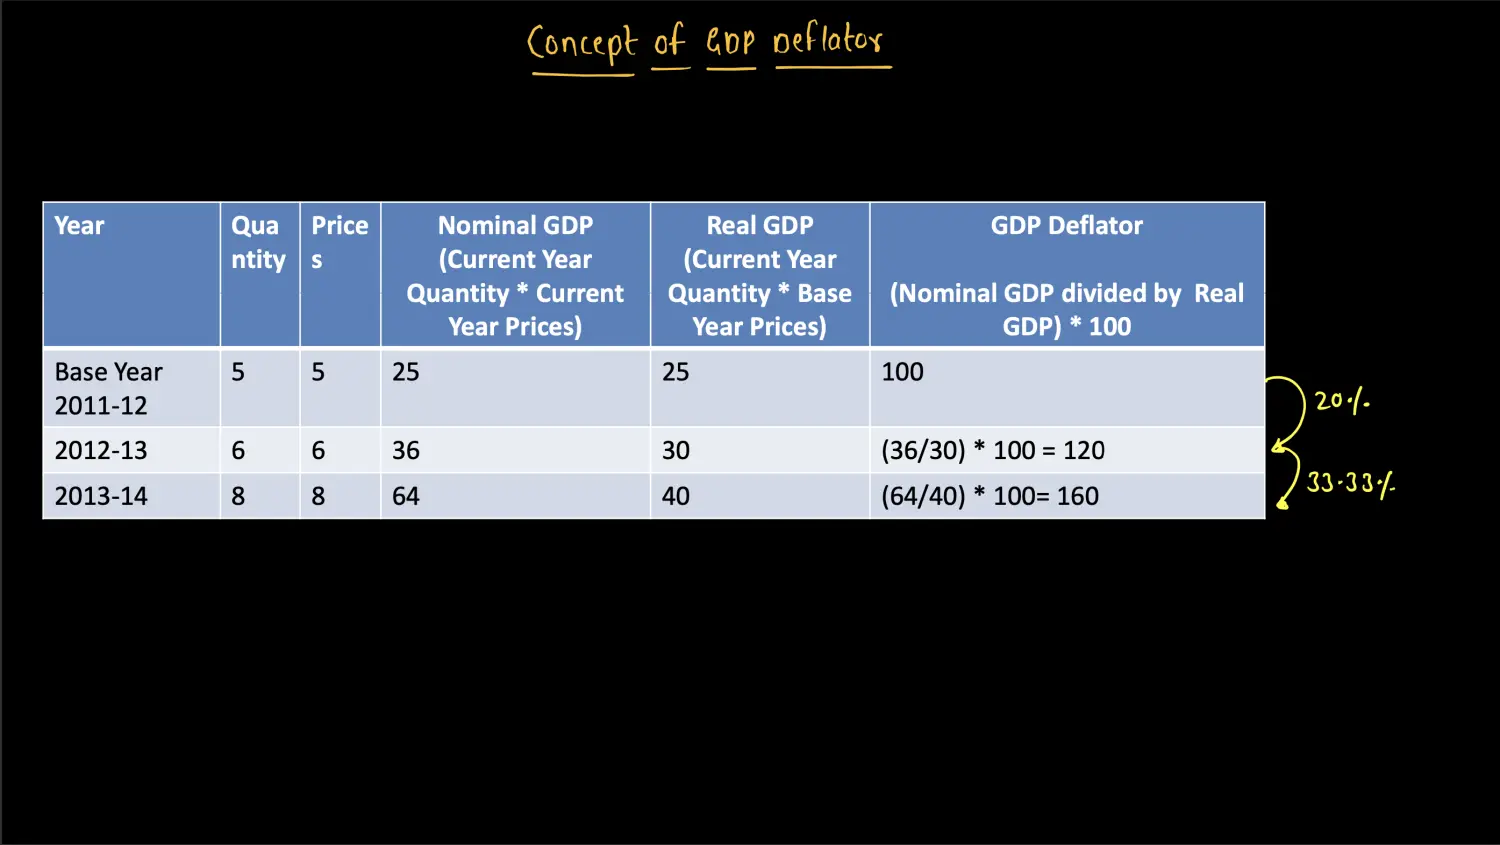
Issue with GDP Deflator
- WPI CPI is Every Month where as GDP Deflator is calculated Quarterly
- There is No Explicit Weightage - Because Qty is Removed
- Imports are NOT Included
Difference between CPI & GDP Deflator
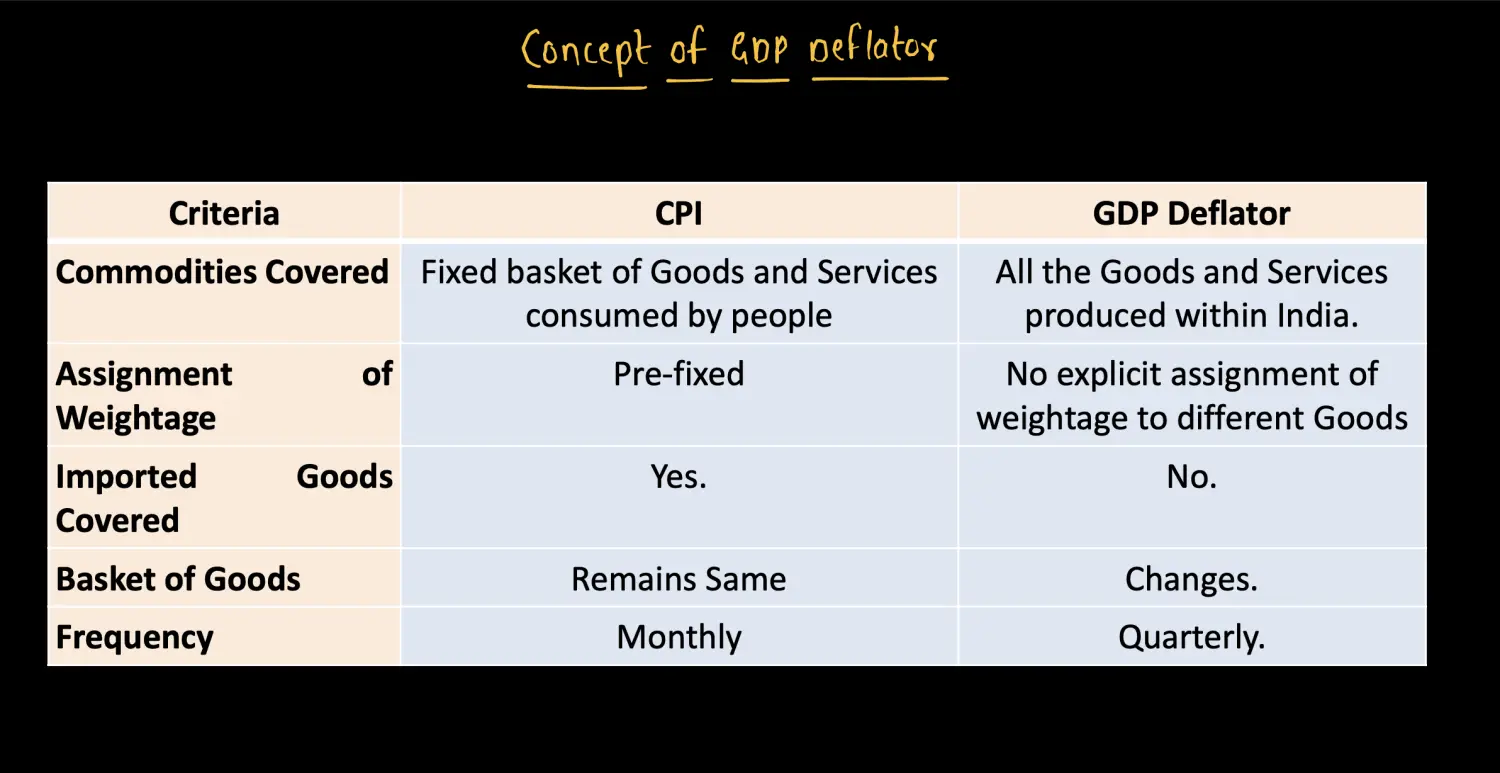
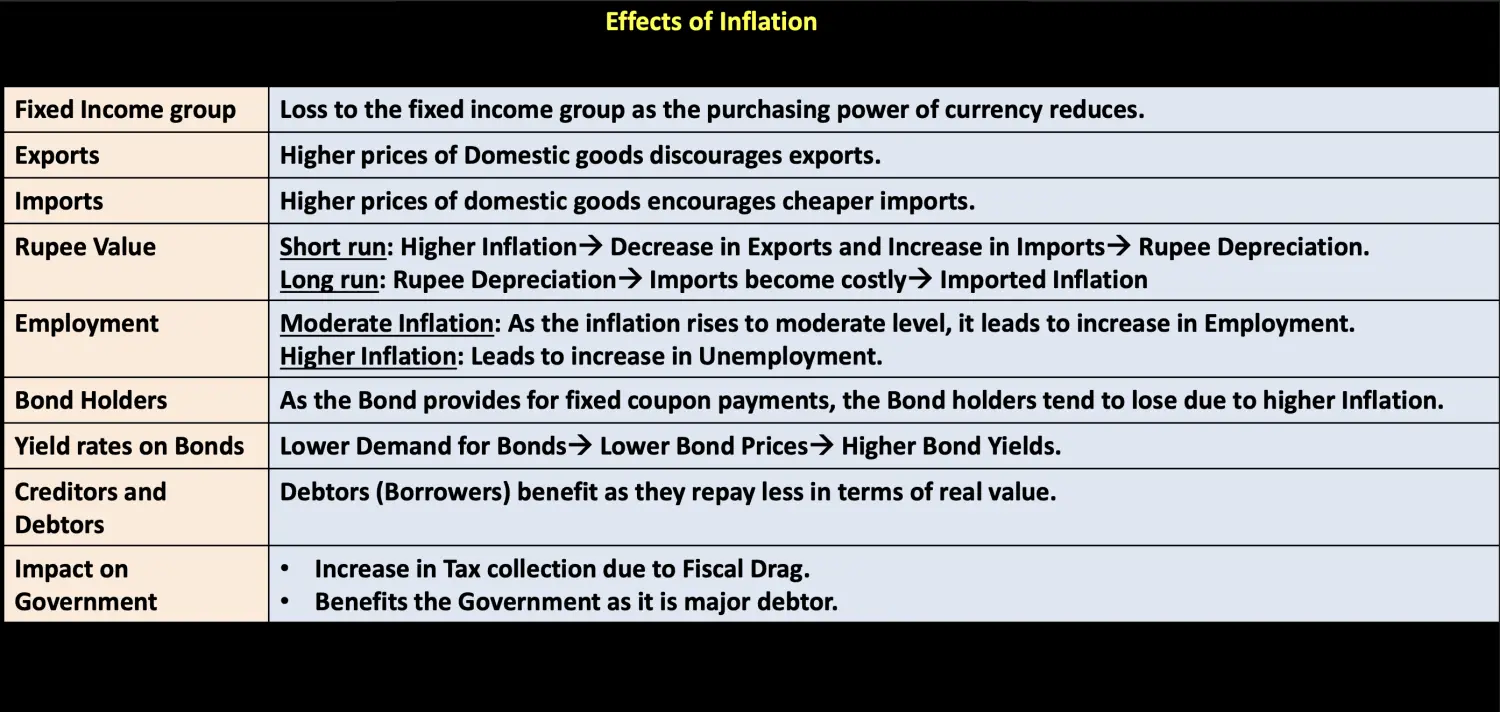
Effect of Inflation Summary
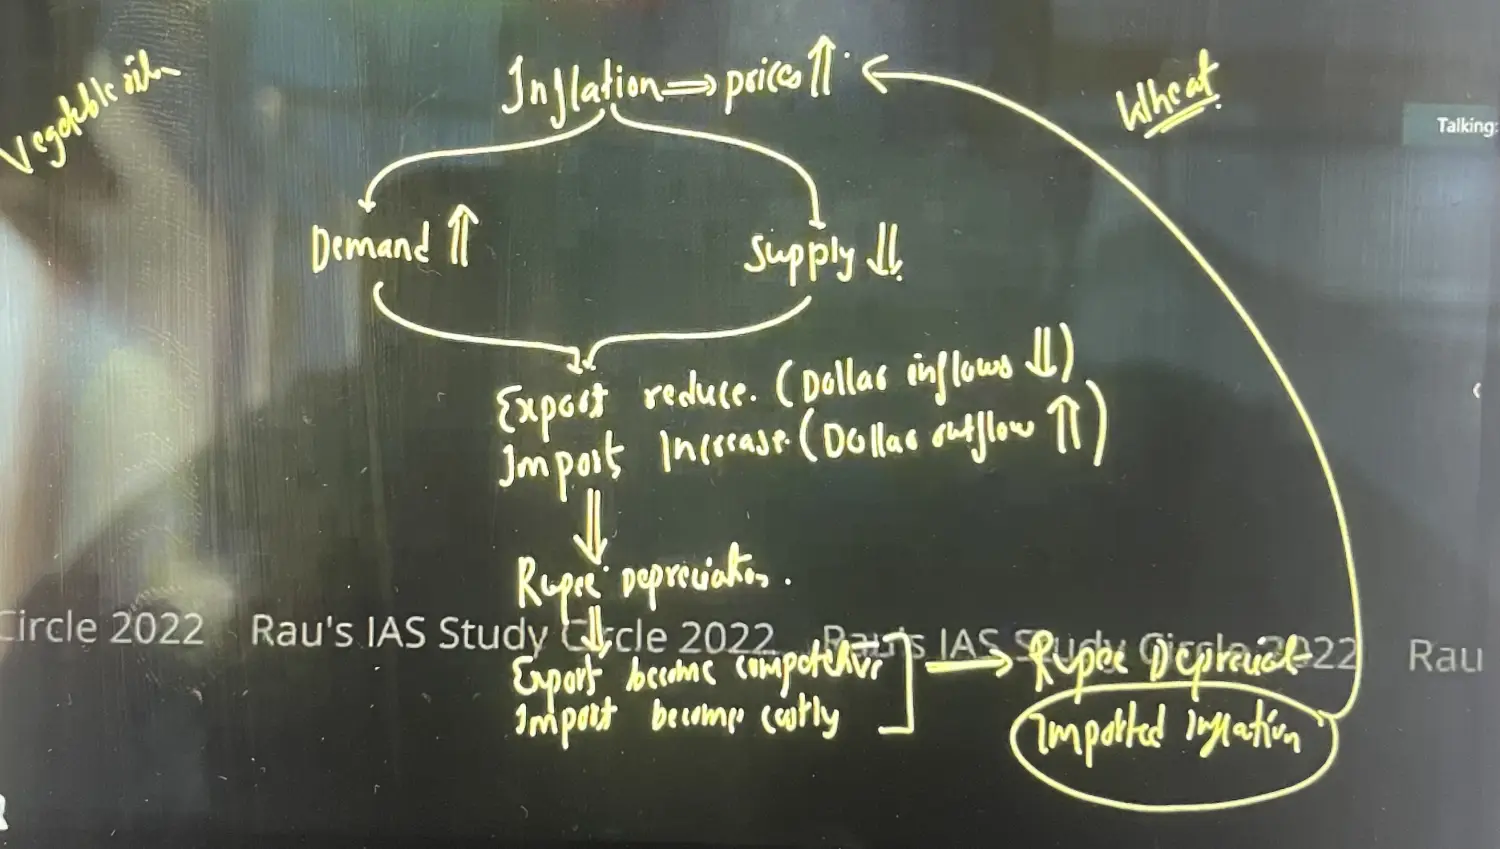
Effect of Inflation on Exports and Imports
Inflation Increases & Rupee Value Depreciates
In Imports and Exports we take into consideration Immediate Effect of Inflation
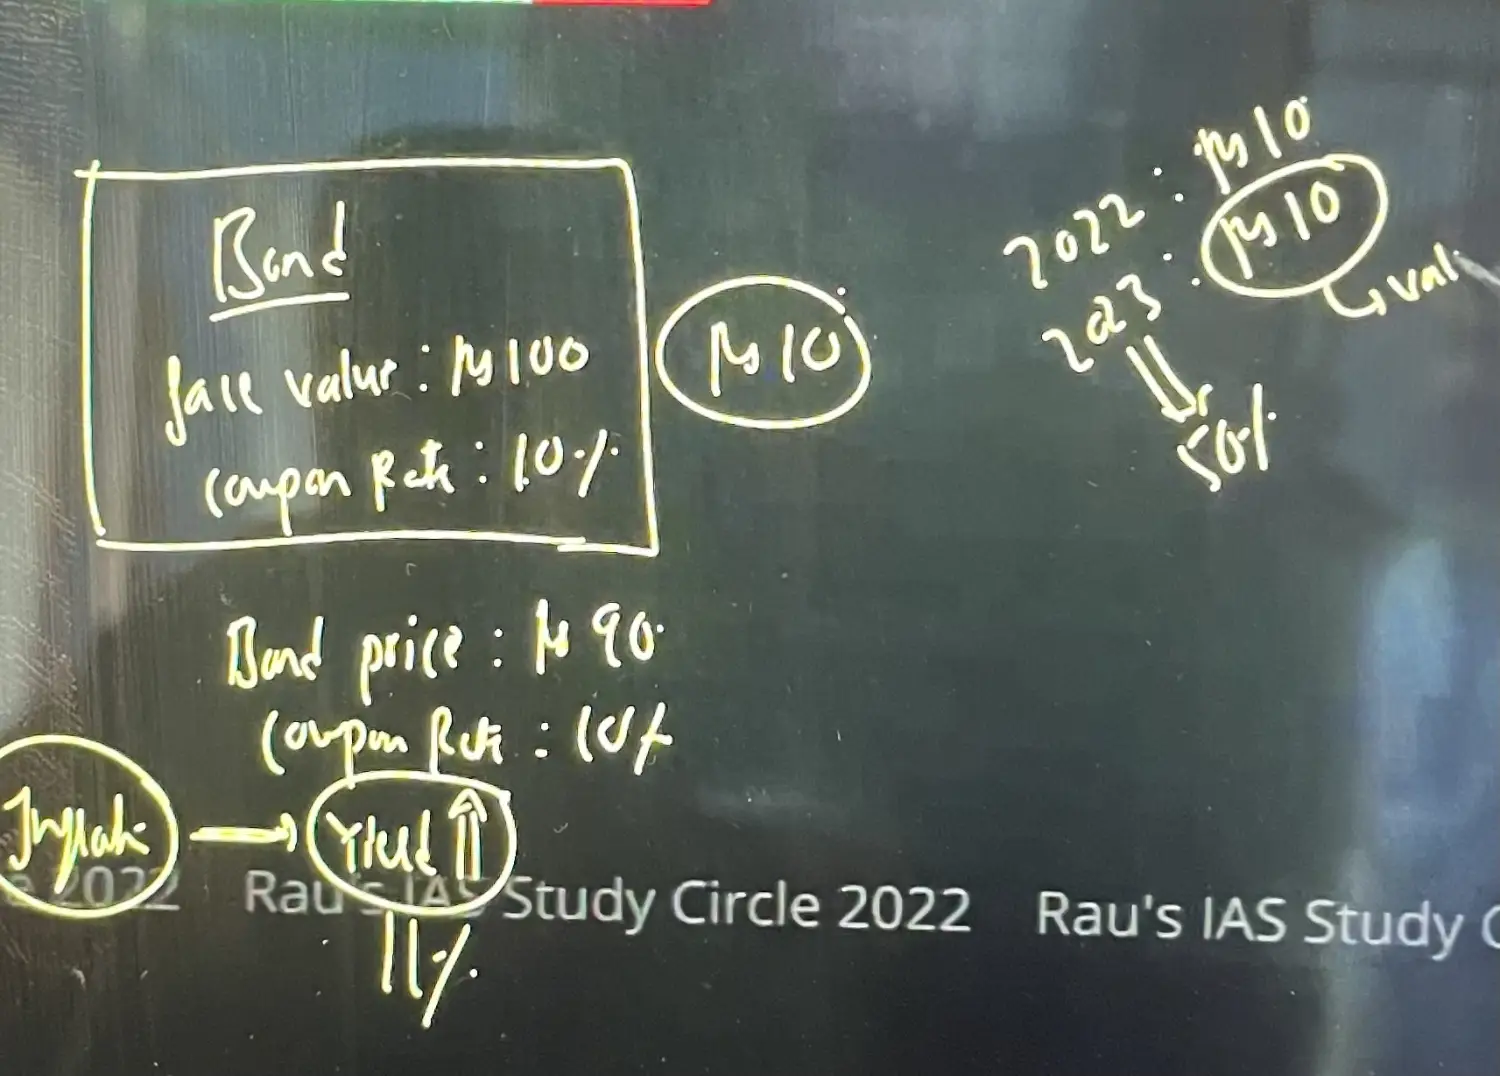
Effect of Inflation on Bonds
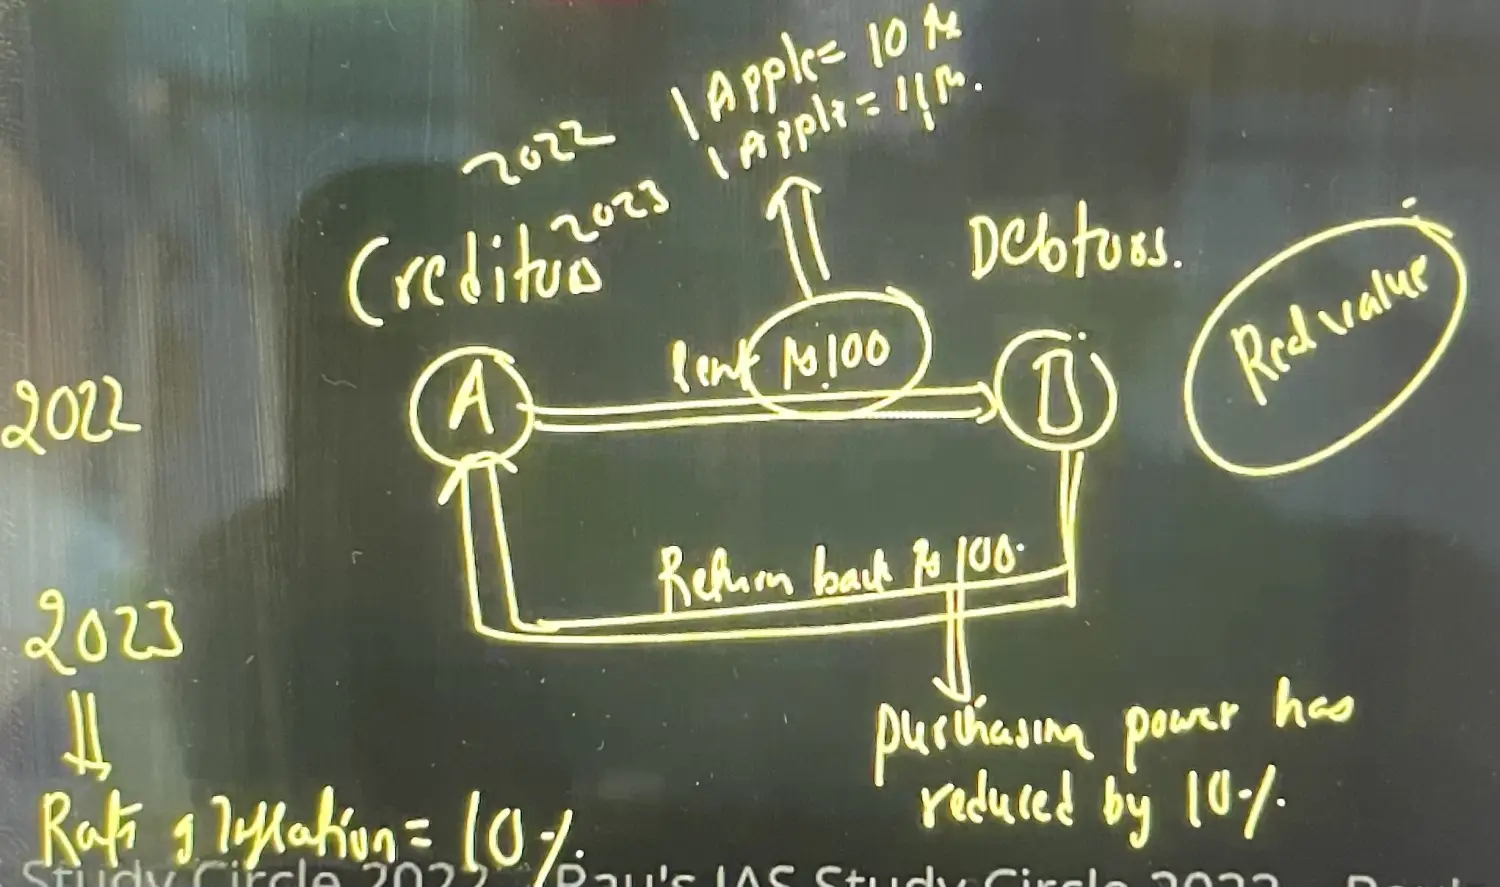
Effect of Inflation on Creditor and Debtor
- Creditor - Jo Paisa Deta Hai - Nuksan
- Debtor - Jo Paise Leta Hai / Jisne Debt Liya Hai - Fayda - Pays Less in terms of Real Value
- Paisa Same aa raha hai, par paise ka purchasing capacity kam ho gaya hai
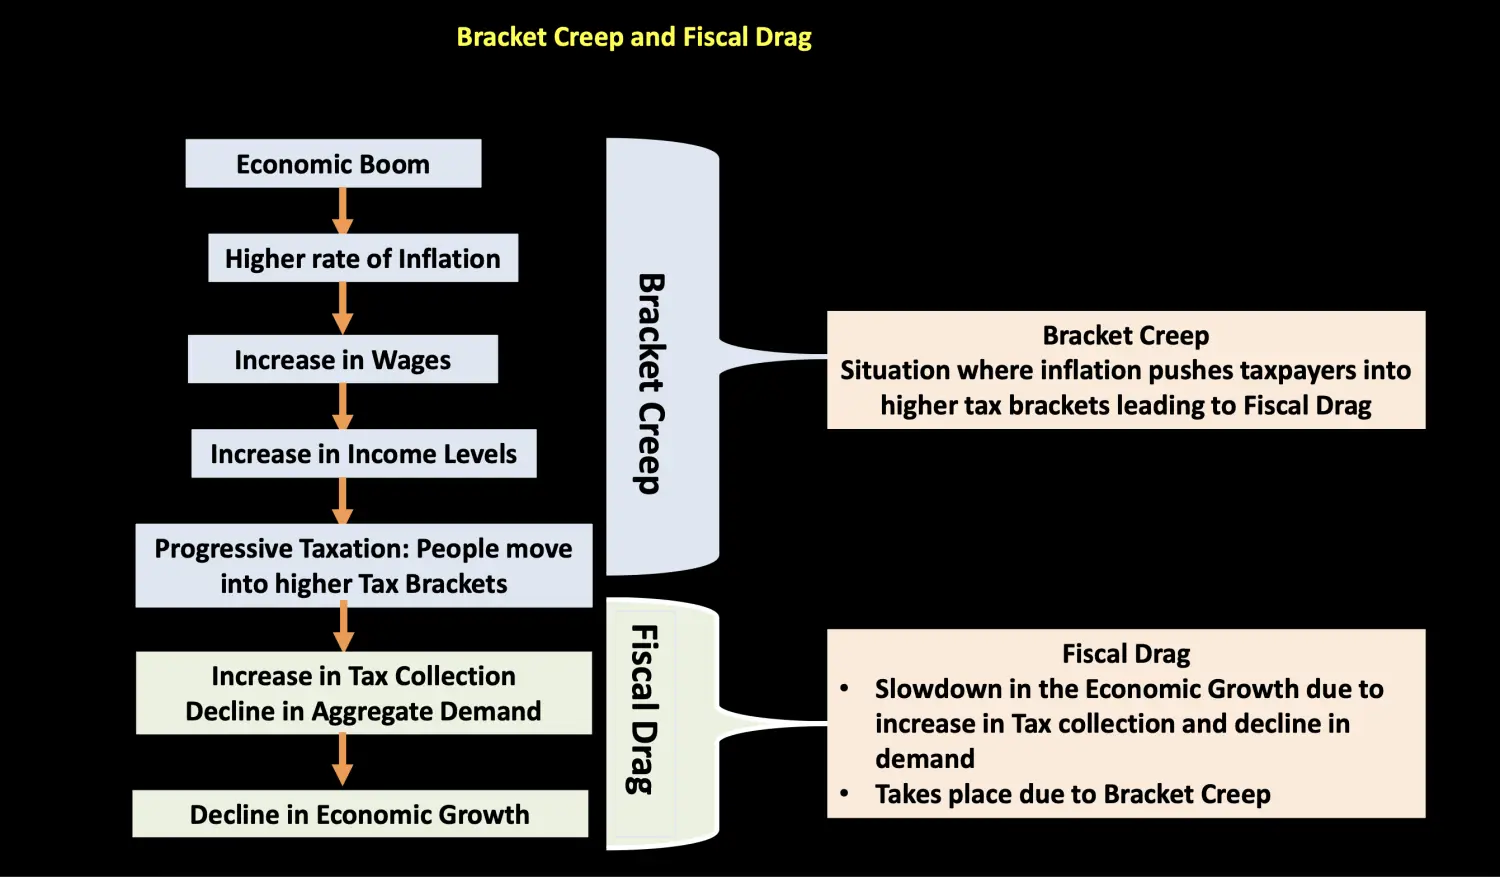
Concept of Bracket Creep and Fiscal Drag
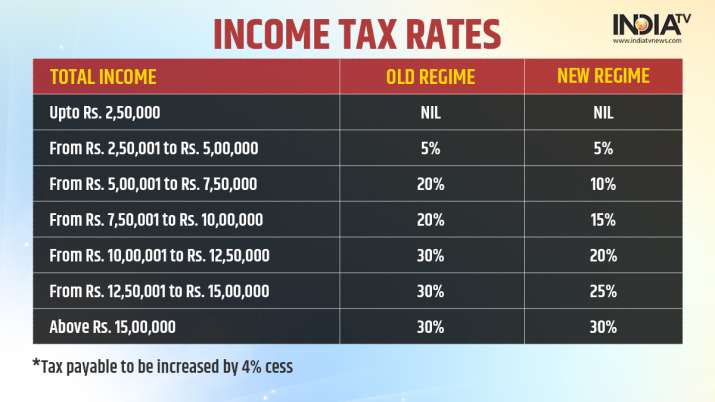
Progressive Tax Slabs
- Increase in Wages → Inflation Indexed Wages
- Increased Income Level Does Not Impact Purchasing Power
- Bracket Creep - Shifting of People from Low Tax Bracket to High Tax Bracket
- Fiscal Drag - When an Increase in Tax Collection by Govt, People have less money to Spend and hence there is a Reduced Demand, Decreased Inflations and Hampers GDP Growth Rate is called Fiscal Drag
- Bracket Creep and Fiscal Drag are Long Term Phenomenon of 2 to 3 Years Normally
Measures to Check Volatility in Prices
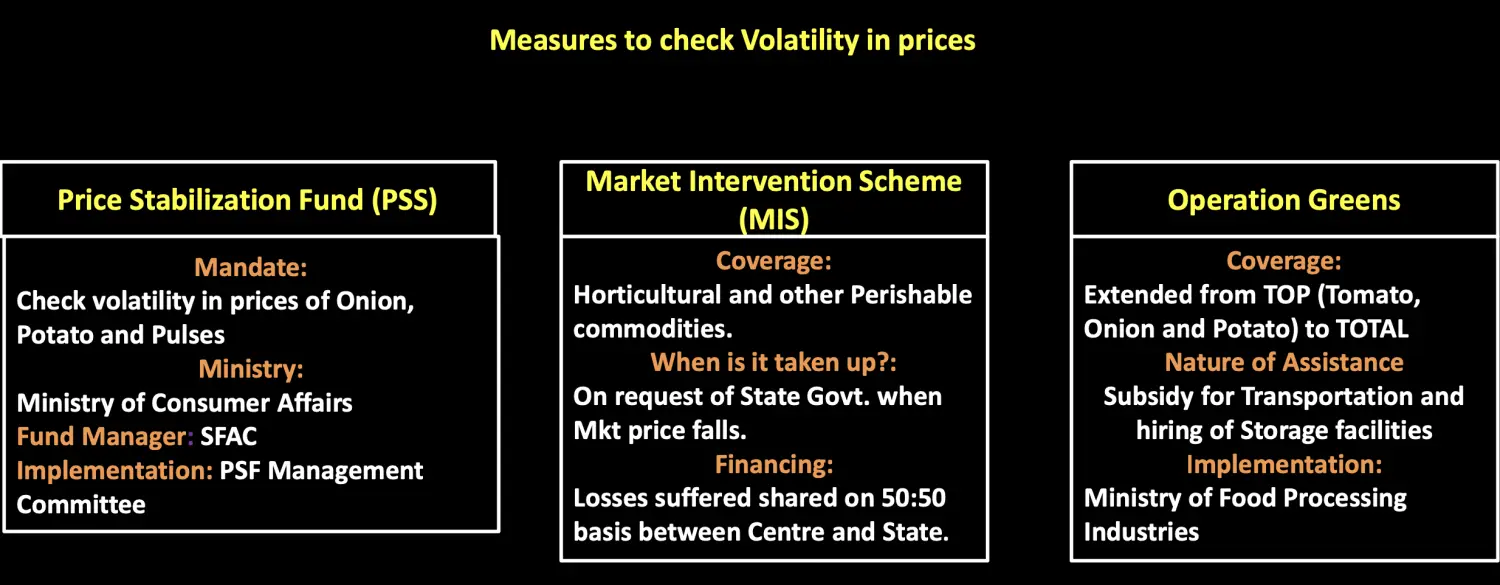
- PSF
- by Consumer Affairs Ministry
- Control Prices of Onion, Potato and Pulses
- SFAC - Small Farmers Agri Business Consortium
- E-NAM - National Agricultural Market
- During Bumper Production - SFAC Procures and Creates Buffer - During Increased Price, It releases the Buffer to Control the Price
- MIS
- MSP - Minimum Support Price is for 23 Items
- By Ministry of Consumer Affairs
- FCI - Food Corporation of India
- MIS Covers Horticultures and Perishable Commodities like Fruits and Vegetables
- MIS is implemented only in the request of State Govt where as MSP is implemented every year
- Loss Faced by MIS Implementation is Equally Shared between Centre and State
- Operation Greens
- Covers TOP Products - Tomato, Onion & Potato
- Implemented by Ministry of Food Processing Industry
- Govt has gone from TOP to TOTAL
- PSF
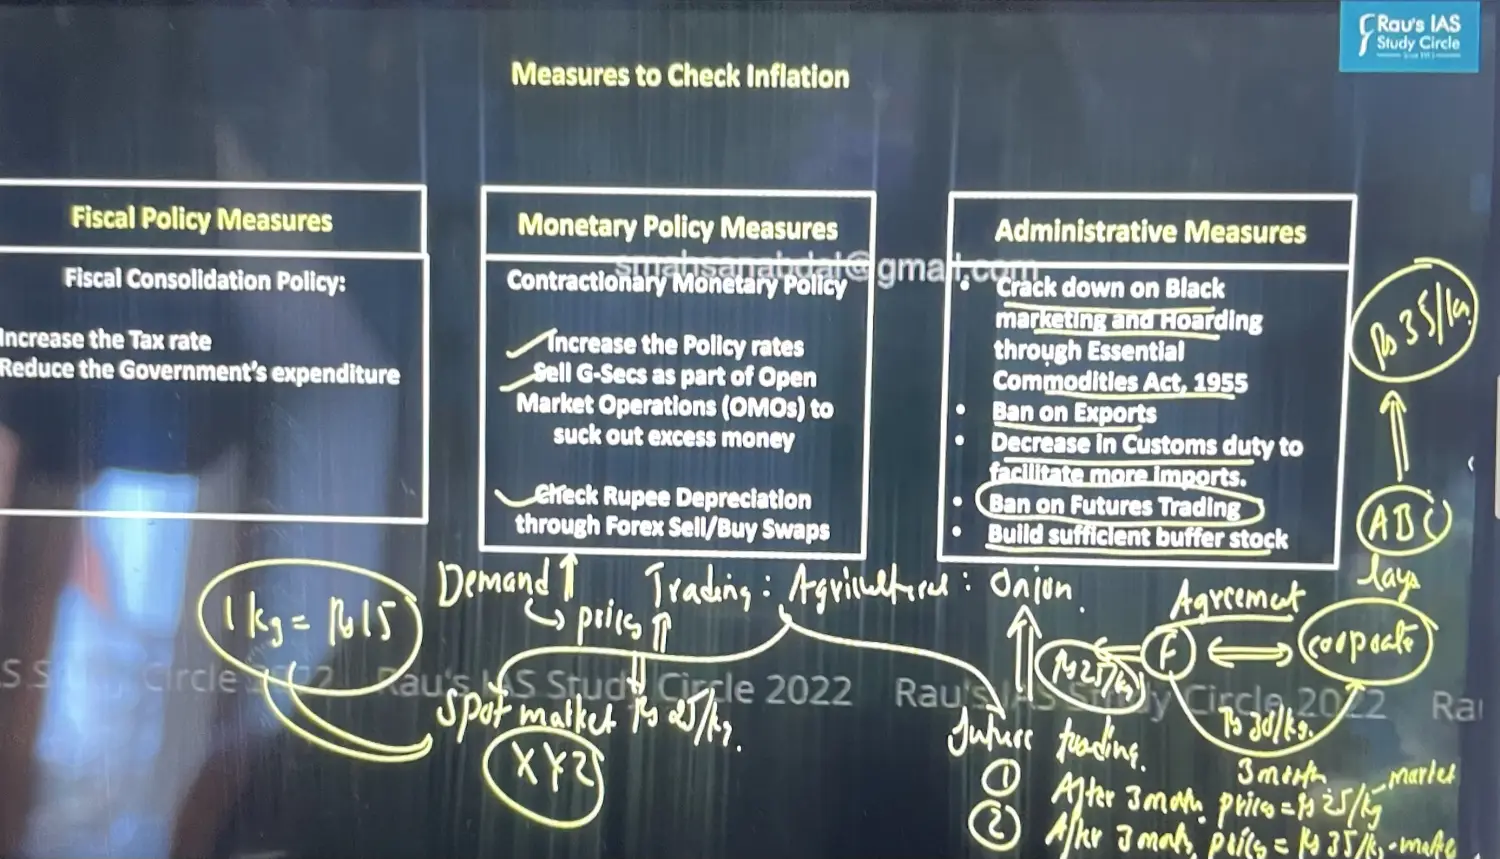
Measures to Check Inflations
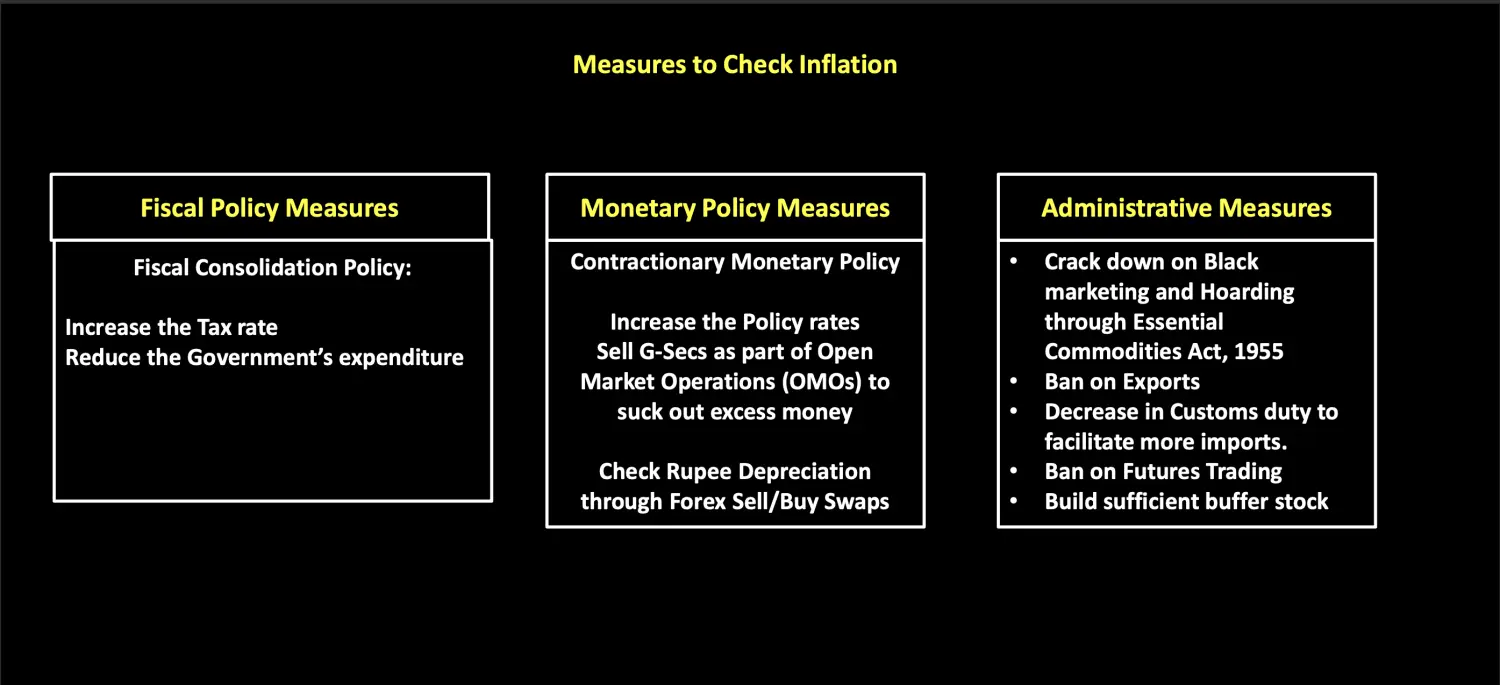
To Check Inflation we need to
Reduce the Demand→ By Govt → Tax Increase and Reduce Exp
Increase the Supply → By RBI → Policy Rates
Futures Trading in (Trading of Agri Commodities)
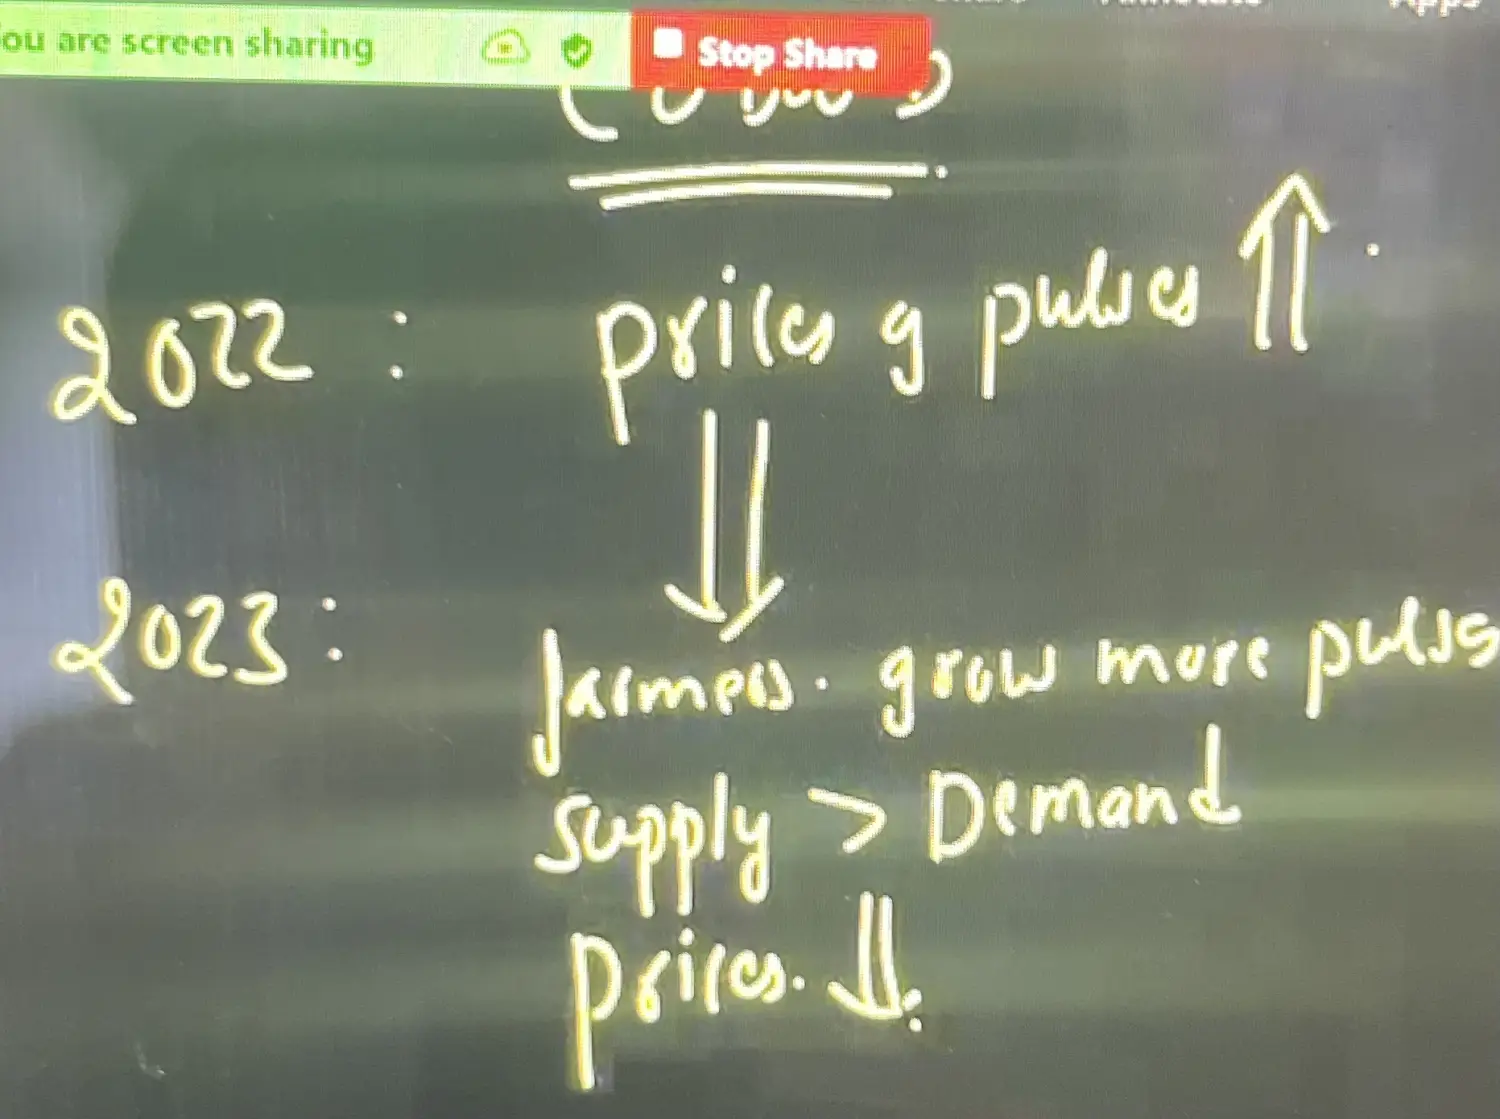
Cobweb Phenomenon in Pulses
Inflationary Momentum
Continuos Increase of Inflation in a momentum is called Inflationary Momentum
Inflationary Premium
Increase Rate of Interest on Loans due to Increase Inflation is called Inflation Premium