2.6 Demographic Anthropology
Part 2 - Physical Anthropology
- Paper 1 - Unit 11 - 11.1 11.2 11.3
Unit 11.1 - Relevance of Menarche, Menopause & Other Bio Events to Fertility, Fertility Patterns & Differentials
Running Notes
Fertility - Pro Creation & Birth to Next Generation
Giving Birth to a Healthy Individual
Menstrual Bleeding Includes
Clearance of Uterine Wall ( Endometrium )
Release of Blood, Clot, Mucus & Epithelial Cells
Traditions Related to India
- Symbol & Interpretative School - Ndembu Tribe
- Case Studies in Different Parts of the World
Menstruation
- 28 Days - Wall of Uterus Endometrium
- Facilitated by LH & FSH from Pititutary Gland
- Release Oestrogen & Progesterone
- Development of Secondary Sexual Character
- Fatty Deposition
- Gain in Weight
- Breast Development
Menstruation, Menarche & Menopause
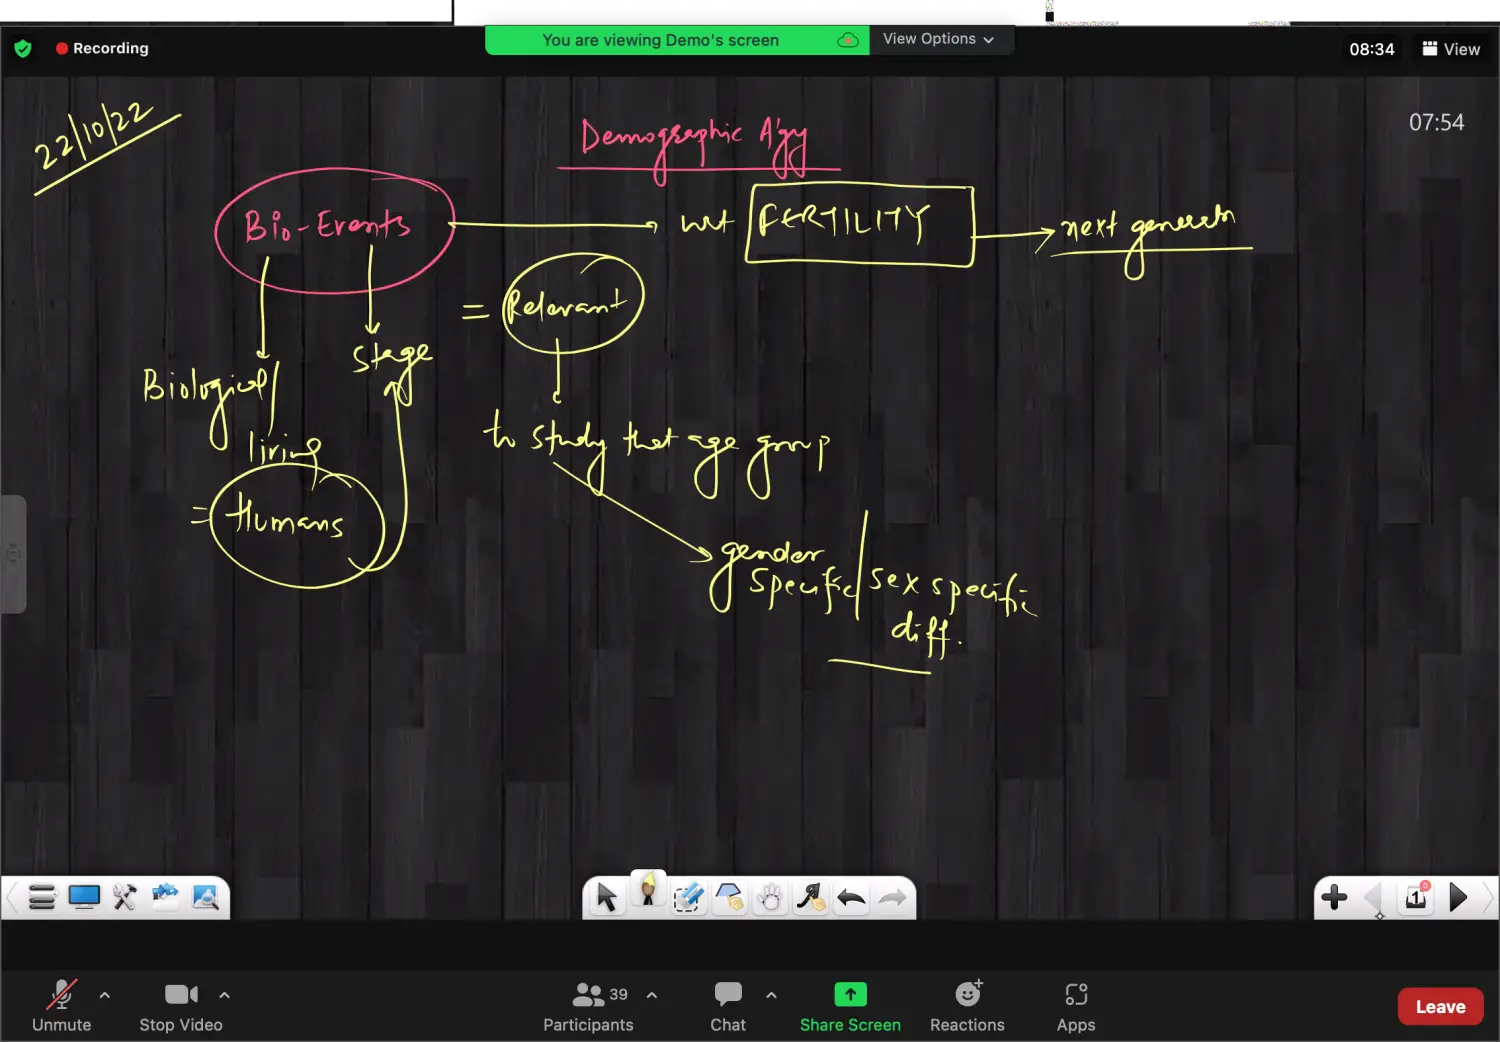
What are Bio Events ?
Bio Events in Humans are related to certain significant biological changes in body physiology and anatomy marking the beginning, maturation or cession of some specific bodily change.
These bio events can be gender specific & age specific, depending upon biology of the body, genetic factors, environmental factors and nutritional factors etc
Example of Bio Events
For example, beginning of menstruation in females is the onset of puberty and as a result of that healthy eggs are being produced, which can be fertilised with healthy sperm giving rise to a new individual
Beginning of menstruation is menarche & when it stops in females it is Menopause ( Climacteric )
Menstruation, Menarche & Menopause
Menstruation
What is Menstruation ?
Menstruation is the function of Uterine Wall (Endometrium) established at puberty at an age of 11 to 14 years in general in females
What are the Variations in Menstruation ?
Various Studies have highlighted, that the world wide average is 13 Years which can be even upto 14 Years on an average, if tribal and isolated communities are considered
A Periodic Activity of Ovary and Menstrual Discharge is on an average after every 28 days, which can have variations of 2 to 5 days
Average Menstrual Bleeding is of 3 to 5 Days and 90 to 200 ML blood loss occurs. It has both blood clots as well as the fresh bloods with Mucin's and Epithelial Cells.
What Hormones control Menstruation ?
FSH & LH released by pituitary gland will stimulate the endocrine activity of ovary and hence the secretion of Oestrogen/ Estrogen & Progesterone is increased. This in turn stimulates the growth of secondary sexual characters in girls like Fat Deposition in Body, Gain in Wight & Height & Breast Development
What is the Social Significance of Menstruation ?
Beginning of the Menstruation i.e Menarche is having both Social & Biological Significance in perspective.
Social Perspective → Kanga Rituals in Ndembu Tribe of Africa
Menarche
What is Menarche ?
Beginning of formation of Healthy Eggs required for Fertilisation with Sperm that is possibility of fertility starts after healthy egg formation of Menarche
What are the Factors that affect Menarche ?
Various factors define the age of menarche, along with biology of body, genetic factors, environmental factors, geographical conditions, ethnicity, upbringing, family situation, stress etc determine the early or late onset of menstruation
Various Studies have suggested that Average age of Menarche is lesser in Western countries as compared to Asian Countries.
Cite the Study by A M Tripathi with regards to trend in Menarche ?
Study by A M Tripathi on age of Menarche in Different Regions of India found that Lowest Age of Menarche is in Girls of Delhi, Followed by Calcutta and UP & Highest Age was witnessed in Gujarat.
After the Onset of Menstruation in Girls, in the first 15 to 18 months, more than 80% of the cycles are Anovulatory i.e either without release of egg or with an unhealthy egg.
After onset of Menstruation, Growth of Uterus takes place, with improved vascularisation (blood supply increases) & fatty deposits on various body tissues begin.
What is Isolated / Pre Mature Menarche ?
Due to Various factors Menstruation can begin early in certain girls, with marked early signs of puberty termed as Isolated or Pre Mature Menarche.
Reasons for - Pre Mature Menarche
Also called Isolated Menarche
Probable Reasons can be a blend of biological, lifestyle, environmental, diseased condition & various other factors
Child Obesity
- Eating of Junk Food
Genetic & Hereditary Factors
- Like Early Onset of Menstruation in Previous 1 2 or 3 generation
Endocrine Disorders
- They lead to Hormonal Imbalance that is Dominance of Sex Hormones over the Growth Hormones
- Girls being exposed to Sex Hormones like
- oestrogen Ointments & Injections leading to early Maturity in cases of child trafficking, prostitution, etc
- Girls exposed to Adult Medications, not suitable for children or heavy doses of medicines can increase the child's risk of having an early menarche
- Pathogenic & Carcinogenic Conditions
Stress
- Stressful Conditions of unhealthy family environment
- child sexual abuse
- physical or mental burden to perform in studies, sports, events, etc
Pollution
Various Studies have highlighted that excessive exposure to high air pollution and toxins present in food can trigger hormonal imbalance and early onset of menstruation
Physical Activity
- Lack of Physical Activity in Late Childhood
- Excessive Physical activity leading to Physical Stress
Parenthood Conditions
- like Girl Child w/o parents or with a Single Parent
- A Study in European Girls after Second World War, found that girls without father were having early menarche
Singleton Babies
Studies related to singleton babies suggested that “Only Child Syndrome” and subsequent pressure leads to early onset of menstruation
Exposure to Intoxicants
- Girl Child Exposed to Intoxicants like Smoking, Drugs, Alcohol etc
- Even girl child of mothers taking intoxicants during pregnancy
Conclusion - Pre Mature Menarche
Early Onset of Menstruation in Girls can trigger early menstruation in subsequent generations
Not necessarily in the first generation, but may be in the second or third Generation
Reasons for - Later Menarche
Endocrine Disorders & Pathogenic Conditions of the Body
Malnourishment
particularly very less fatty acids & less fatty deposits in the body
Single Child
Over Pampered - Totally Stress Free Environment
Larger Families
When Girl Child has no of Elder Siblings, it is witnessed that is part of later menarche
Amenorrhea
Amenorrhea is absence of Menstrual bleeding which can be due to ovarian disorders, central nervous system disorders or rudimentary reproductive organs
It can be lifelong, affected individuals have disturbed growth and development and are maximally infertile
Menopause / Climacteric
- Whats is Menopause
- This is Cessation of Menstrual Bleeding
- Average Age is 49 to 50 Years
- Meaning, there is No Egg Formation and Release. Hence No Fertilisation and No Child Bearing
- In Medical Sense it is defined as absence of menstrual bleeding in the last 1 year
- What are the Symptoms of Menopause ?
- In years before menopause, a women period typically become irregular, for may be longer or shorter duration, with a lighter or heavier blood flow, also certain psychological disturbances like frequent irritability and some issues with memory can take place
- Most Prominent clinical symptom is occurrence of HOT FLASH in duration of 10 seconds to 8 to 10 minutes when there is a sudden feeling of warmth most intense over the face neck and chest region with profuse sweating
- Menopause is a usually a Natural Environment, but can be triggered by certain factors like smoking, excessive alcohol consumption, excessive medication chemotherapy etc
- Possible effects of Menopause
- 1 Skeletal
- Muscle Pain
- Pain in the Joints
- Issues Like
- Osteopenia
- Loss of Bone itself
- Osteoporosis
- Loss of Bone Density due to reduction of Calcium Deposits
- Osteopenia
- 2 Skin & Soft Tissue
- Breast Atrophy
- Reduction in Size of Breasts
- Breast Tenderness
- Tenderness Reduced
- Thinning and Dryness of Skin
- Breast Atrophy
- 3 Psychological & Mental
- Irritability
- Some Sort of Issues with Memory
- Social Stigma and not being understood by family
- Empty Nest Syndrome is more prominent in this phase
- Anxiety & Depression
- 4 Sexual Factors
- Vaginal Dryness
- Painful Intercourse
- Reduced Sexual Desires
- 1 Skeletal
- Whats is Menopause
Unit 11.1 & 11.2 - Combined
Unit 11.2 - Demographic Theories - Biological, Social and Cultural
Unit 11.3 - Biological & Socio Ecological Factors Influencing Fecundity, Fertility, Natality & Mortality
Definition of Fertility
According to Thompson and Levis is used to indicate the actual reproductive performance of women or group of women. No of Births per thousand population per year is one significant measure of fertility
Crude Birth Rate : No of Births per Thousand Population
Crude Death Rate : No of Deaths per Thousand Population
Definition of Fecundity
Capacity of a Man or a Women that is a couple to participate in reproduction.
Capacity to Reproduce a Child by Men and Women
What is the Relations Between Fecundity & Fertility
- Fecundity is the Reasons & Fertility is the Outcome
- Fecundity is the Biological Concept where as Fertility is the Socio Cultural Outcome
Introduction Summary
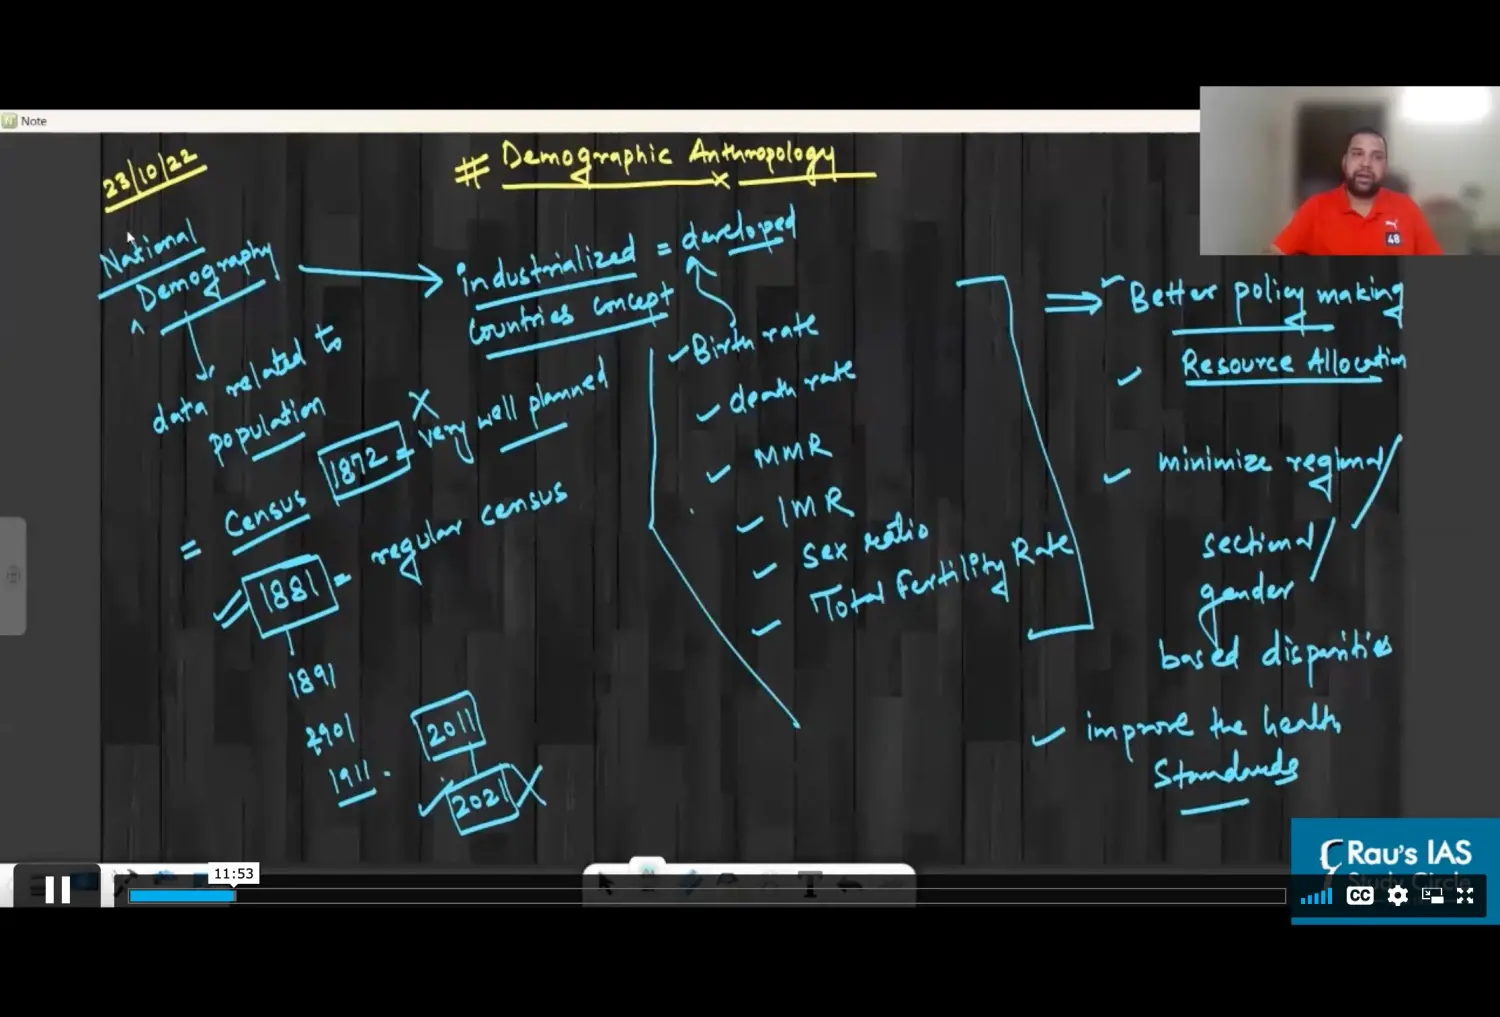
National Demography
Primarily Focuses on large data sets often derived from census Particularly from industrialised developed western countries & hence was a phenomenon of relatively small part of the world.
It was based on various demographic indicators like
Birth Rate, Death Rate
IMR, MMR, TFR
Sex Ratio
This data was used for
- Policy Making
- Resource Allocation
- Minimising the Disparities based on region section gender
- Improving Health Standards of Population
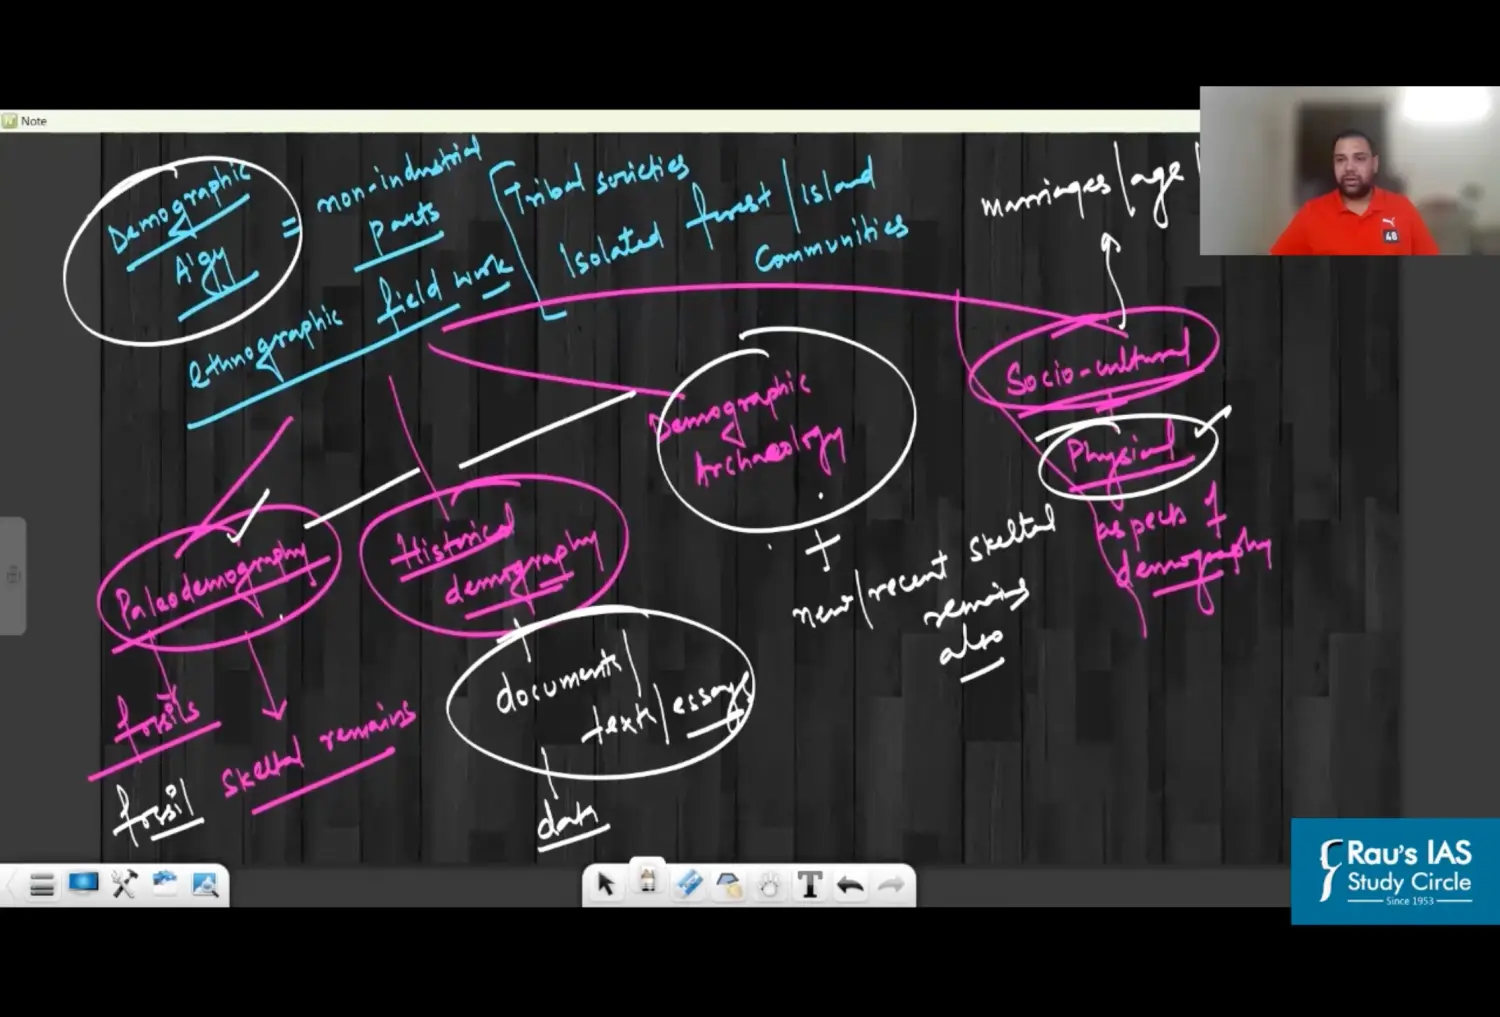
Demographic Anthropology
In Contrast to this Demographic Anthropology focuses on, mainly non industrial parts reaching upto
- Tribal societies
- Rural areas
- isolated forest & island communities
DA is Primarily based on Data Collected through Ethnographic Filed Work
For Example :
- Field Work by Malinowski in Trobriand Islanders
- Andaman Islanders by Radcliffe Brown
It also examines demographic indicators based on
- Paleo Demography
- Based on restructuring the Skeletal Remains of Fossils
- Historical Demography
- Data based on documents or texts already available
- Demographic Archaeology
- Material Culture & other evidence from archaeological sites
- Socio Cultural & Physical Aspects of Demography
- Demographic Data Related to Marriage, Divorce, No of Children, Pedigree etc
DA like other aspects of anthropology has a holistic approach which seeks to understand demographic phenomenon in the context of specific socio cultural, economic, political and environmental settings in which the populations exist
Ultimate goal of DA is not simply describing the demographic characteristics of the present and past populations, rather there is an explicit focus on the application of Demographic Data to address the questions of Evolutionary Ecological and Cultural Nature
Kertzer & Fricker on Demographic Anthropology
In the words of Kertzer & Frick, the relationship between anthropology and demography is a long tortured one. which is often ambivalent and sometimes passionate.
In the sense that anthropological & demographic data for the maximum times. complement & supplement each other & at some other events are contrasting. Hence, its the duty of anthropologists to interpret it in the better way
Fertility & Fecundity
- Fecundity - Ability to Reproduce
- Fertility - Actual Reproduction
Fecundity is basically ability to reproduce which is defined as the maximum reproductive potential of a women under ideal environmental conditions.
Its more of a biological concept but taking into consideration the socio cultural aspects also
Fertility is the actual reproduction or outcome of the reproductive performance of an individual under prevailing environmental conditions.
In other words, Fertility can be considered as a Fecundity, as an outcome based on socio cultural, psychological and economic factors. Hence,
💡 Some FECUNDABLE Women are INFECUND & hence are INFERTILEIn DA, Infertility doesn’t imply only the biological reasons, but also the infecundability due to socio cultural reasons.
Mortality & Natality
Mortality & Natality Usage Context
- Natality is used in context of - Demographic Anthropology & Human Population Ecology
- Birth Rate is used in context of - Population Ecology + Population Biology
Difference Between Mortality & Natality
| Mortality / Death Rate | Natality / Birth Rate | | --- | --- | | Total No of New Deaths, Per 1000 Population, in a specified period of time. Like 1 Yr or 10 Yr | No of Live Births per 1000 population in a specified period of time in a specific region related to a specific gender | | Mortality is defined on the basis of
- Age Specific Infant Mortality Rate U5MR
- Area Specific Deaths in Remote Island
- Gender Specific Deaths of Males & Females
- Community Specific Death Rate in any PVTG | Natality is Defined on the Basis of |
Total Fertility Rate
Total Fertility Rate is It represents Average no of children in a particular population, women are having in their reproductive years i.e 15 to 49 years of age.
Replacement Ratio / Total Replacement Level
Explanation
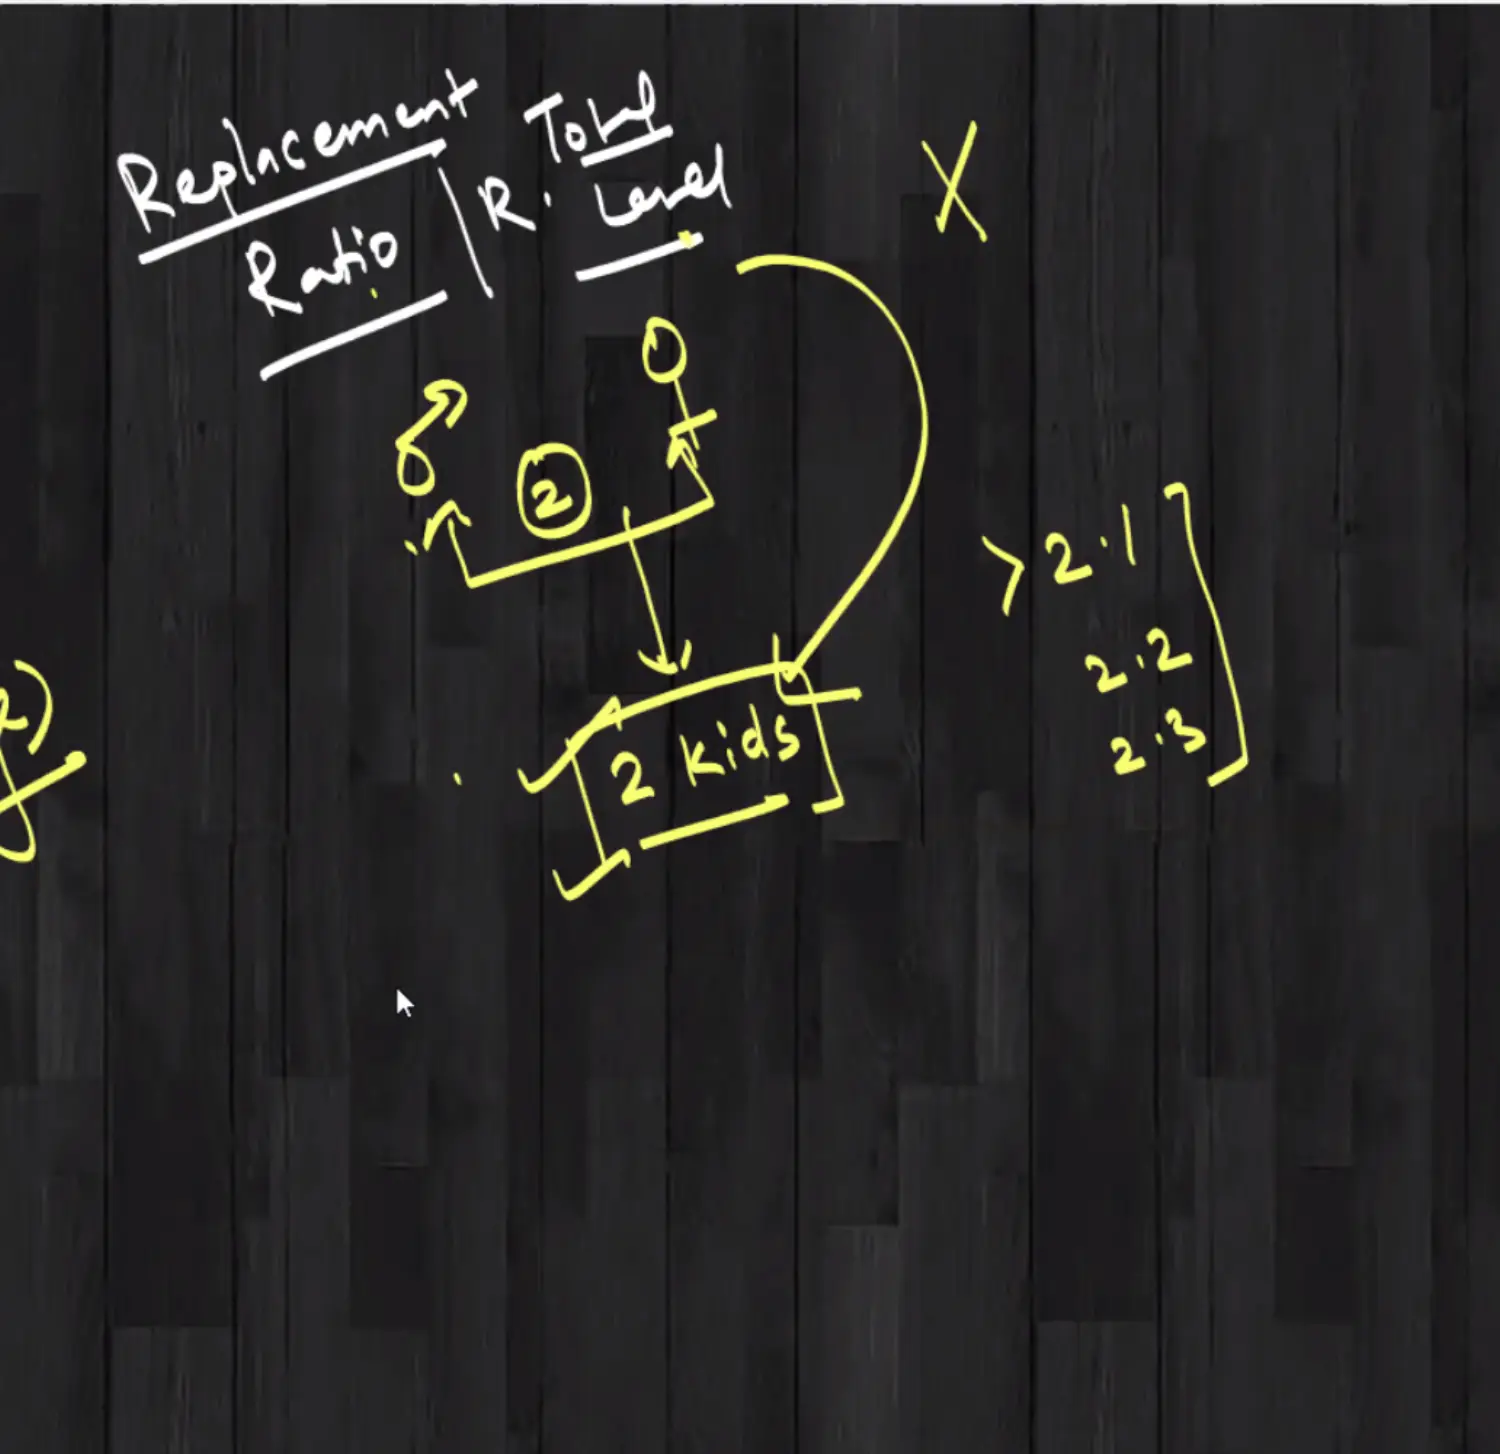
Minimum Number of kIds a particular couple must have to replace their presence, to compensate their death, so that a balance in the population can be maintained.
In Maximum Populations it is slightly above two, can be 2.1, 2.2 or even 2.3
Factors affecting Fertility or Reasons for Differential Fertility
Summary
Biological Factors
There can be multiple biological factors governing fertility, Davis and Blake summarised these factors of differential fertility under 8 different parameters.
1 Age of Marriage & Proportion of Married Population
2 Contraception
3 Intentional Induced Abortions
4 Frequency of Sexual Intercourse
5 Sterility
6 Spontaneous Intra Uterine Mortality
Death of developing foetus due to outside factors like medication, food, injury, intoxicants etc
7 Duration of Fertile Period
15 to 49 is the average age but can be variable in different females
8 Lactational Infecundability - ⭐️⭐️⭐️⭐️⭐️
Running Notes
NOTE : This Specifically can be a 10 M Question
Lactation : Period when a mother is feeding the baby (Breast Feeding)
Lactational Infecundability is Lactational Amenorrhoea
Suckling : The Child who sucks/feeds
Case Studies
Case Studies 1
US Polish Scottish WomenCase Studies 2 Gainj Papua New Guinea Kung Women Botswana Frequent & Short Duration
Factors
It is the temporary Infecundability caused due to, lactation period i.e the breastfeeding period which delays the presumption of normal ovarian cycle & ultimately causing hormonal imbalance.
Suckling Intensity of Breastfeed directly co relates with the Amenorrhea Period i.e absence of menstrual cycle following the birth of the Baby.
Three Most Important Dynamic Components of Suckling Intensity, Contributing towards Amenorrhea are
- Frequency of Suckling
- Duration of Single Suckling Bout
- Total Duration of Suckling in 24 Hour Period
Its not very much that which of these 3 has the most critical role in maintaining the amenorrhea
Suckling Intensity is highly variable in different populations, which has been suggested by
Case Study 1 - US, Scottish & Polish Women Minimum of 6 bouts per day Total of 60 Min Per Day will maintain Amenorrhea for a period o 1 Year
Case Study 2 - Studies on Tribes Kung Women in Botswana Gainj Women in Papua New Guinea Very Frequent & Very Short Suckling Bouts of about 2 to 3 minute can induce amenorrhea for even upto 2 years
Conclusion : Lactational Infecundability associated with changes in hormones is one of the significant biological factors affecting fertility.
- Theory of free radicle reaction-Packer and smith
- Free radicles of oxygen are getting continuously produce in the cells leading to damage and death of cells as the free radicals of o2 can be transformed easily into superoxide radicle by various enzymatic activities
- When this superoxide radical gets combined with water a highly reactive radicle of hydroperoxyl ho2 is getting formed
- Will primarily combined with free unsaturated lipids ,circulating in the cells to form the ageing pigment -Lipofuscin
- The free radicals and lipofuscin will block the cellular transport,i.e influx of nutrients inside of the cell and outflux of toxins outside the cell. This will lead to cell sensance and cell death
Economic Factors
1 Distress from Poverty & Inflation && Illiteracy
Distress from Poverty, Unemployment & Inflation can reduce the fertility rate in population due to day to day struggle for food and nutrition.
But in certain developing countries like India, Pakistan, Bangladesh, Nigeria etc due to illiteracy and unawareness large family size is considered favourable & Hence Fertility rate is high
The Notion is more hands will earn more
2 Cost Benefit Ration ( Theory of Leibenstein)
Summary
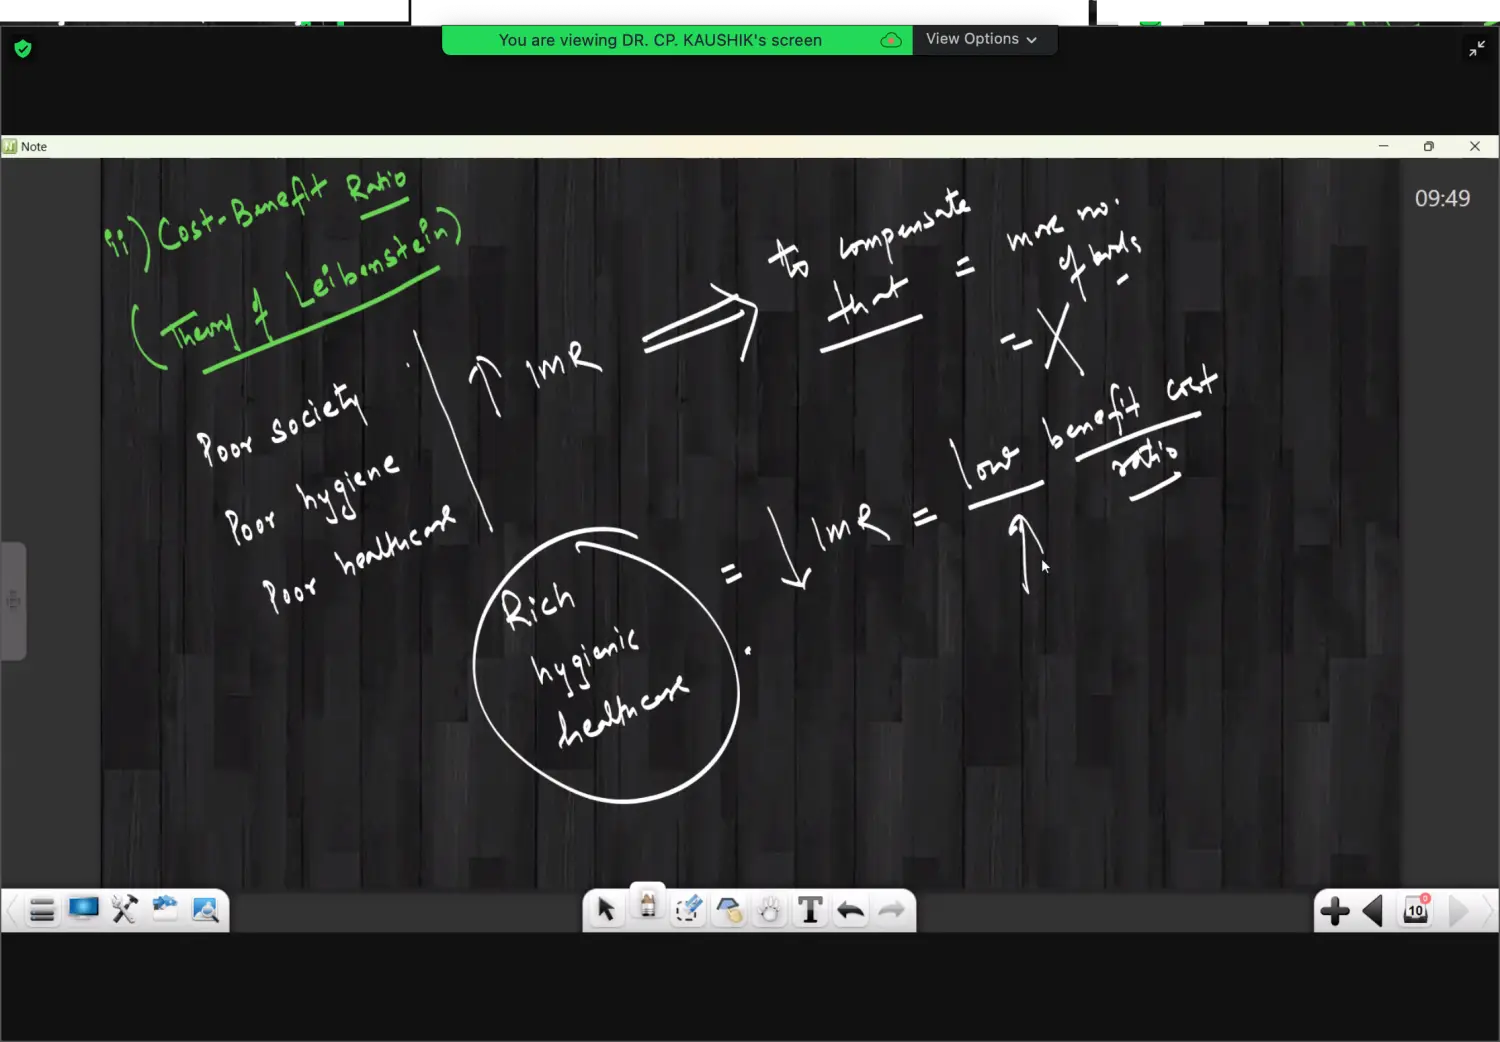
There is High IMR in poor societies due to unavailability of healthcare and poor hygiene. So to compensate that loss, people tend to have more kids (misconception)
In Well of Rich Societies, with Hygienic Surrounding & health Care Facilities, more children are viewed as Low Benefit Cost Ratio because of very high expenditure in good upbringing of the kids
3 Rising / Raising Socio Economic Status of Women
NITI Aayog : Crime of Repeated Pregnancy is on Women
With Rise in Literacy in Women, better participation in socio economic parameters occurs, which in turns increases the say in decision making because of which women have greater control over their body & hence total fertility rate and repeated pregnancy is decreasing.
Where as in Underdeveloped societies in some parts of India as well as world,
- Less literacy or awareness in females
- Less participation in Decision Making is leading to High Fertility Rate
& Crime of Repeated Forced Pregnancies on Women is forced on them
Data from National Family Health Survey suggests that
States with Highest Female Literacy Rates
- Himachal in North
- Kerala in South
- Mizoram in North East
& they have corresponding Minimum Total Fertility Rate
4 Becker’s Theory of Behaviour of Economics
The Theory highlighted that Knowledge Attitude & Practises of Family Planning are the most important factors determining the Fertility Rate
Next is Income which is when higher will lead to higher aspiration of child and higher fertility
Criticised by Easterline’s theory of Parental Aspiration i.e it is the Aspiration of Parents which defines the Fertility Rate and not the Income
Socio Cultural Factors
- Societal Norms
Joint Family Changes from Join Family Structure to Nuclear Family Structure → Leading to Independence for Family Planning
Son Meta Preference Social Stigma or Preference for SON → Leading to repetitive pregnancies
Urbanisation Urbanisation will reduce the rate of fertility ; as per 2011 census TFR of Rural Areas was more than Urban Areas
Literacy & Awareness Literacy and Awareness will reduce the fertility rate of ; Example : Rural India Literate & Aware Female : 3 - 4 Illiterate Unaware Female : 4 - 7
Age of Marriage Evils Like Child Marriage / Early Age Marriage → Increased Fertility Rate Practises of of Polygamy will Increase Fertility Rate
Contraception
Taboo : To Not Use Unawareness : Not Knowing the Usage of
Various Practises based on Religion, caste, race, local community, society, etc Significantly impact the fertility rate
- Religion
- Practises
- Accepted
- Societal Norms
Theories of Population
Summary
Important Notes
- If a 20 M Question on any one theory comes, First Page should be written by citing example of all the theories
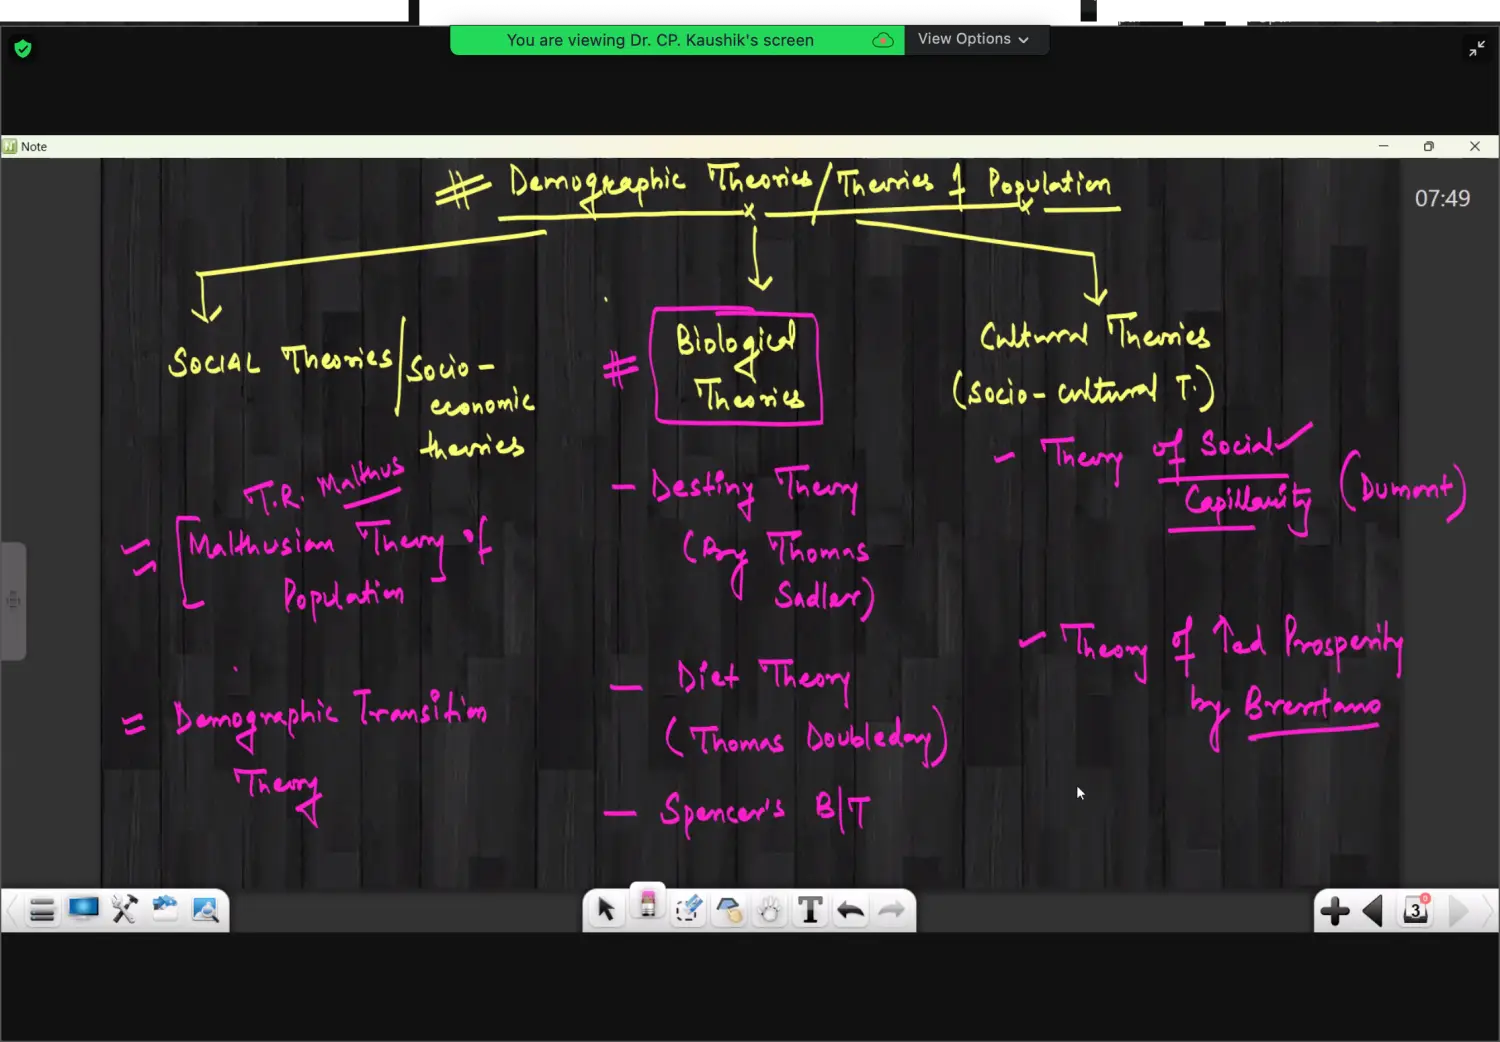
Social Theories - Socio Economic Theories
Malthusian Theory of Population - by T R Malthus ⭐️
Summary
Introduction
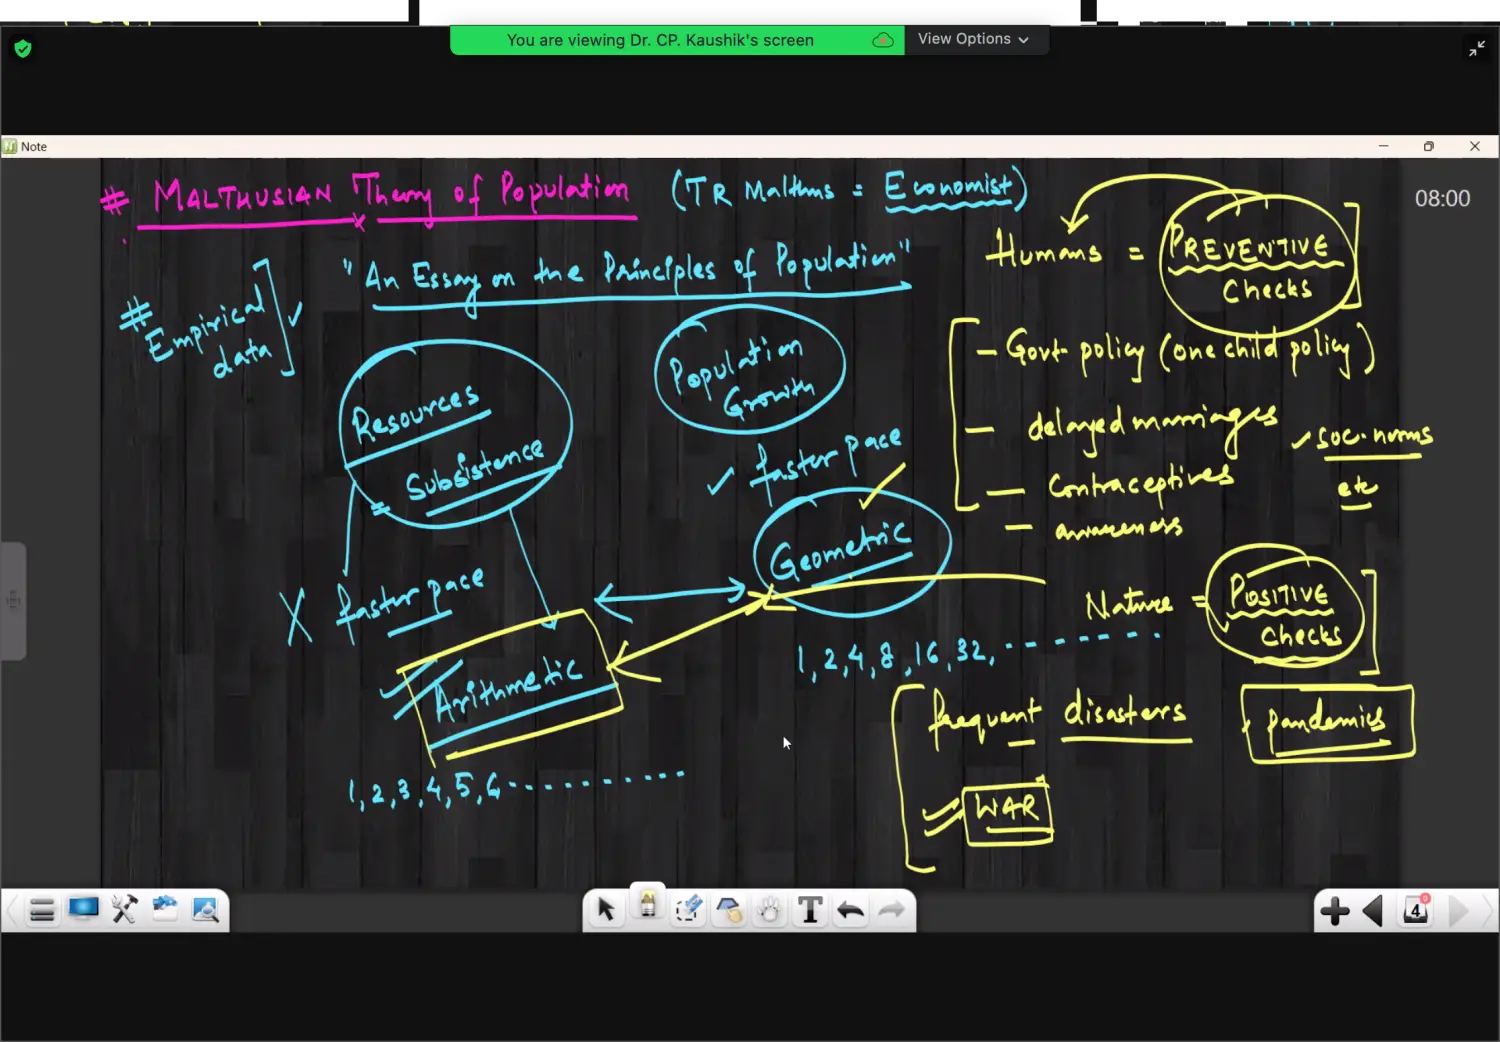
- T R Malthus was an Economists
- Explained this Theory in his Essay : “An Essay on the Principles of Population”
- Based on Empirical Data ; wasn't Rhetoric
Simply Said
- Resource Grow in Arithmetic Progression
- Where As, Population Grows in Geometric Progression
Body
This was the First Systematic Study for Population. His Expression on Growth of Population was a Landmark in the History of Population Theories.
Malthus Proposed that, Human Population can grow Exponentially and can be easily doubled with each cycle, while the resources, subsistence or the Food Production ; do not easily catch up with the rate of growth of population
Malthus Maintained that, Human Population if unchecked, tends to grow, geometrically (1,2,4,6,8 …..)
Where as the Resources and Subsistence, can only grow in an Arithmetic Way (1,2,3,4,5,6 …..)
This Scenario of AP of Resources & GP of Human Population will lead to a Future when Humans wont be having any resources to survive on
So Malthus Considered that, it is the Duty of Mankind, to keep the Population at Such a Level that it could be supported with the Available Resources
To regulate the Population Rise ”There are preventive checks from the Side of Humans and Society”
- Government Policies ( One Child Policy)
- Contraceptives
- Delayed Marriages
- Awareness
- Social Norms
If Preventive Checks from the Human Side are not fulfilled, nature will adopt positive checks to influence & regulate the Growth of Population
These Positive Checks will Increase the Death Rate to a greater extent & will reduce the Birth Rate to a Lesser Extent
These Positive Checks can be
- Frequent Natural Disasters
- Spread of Diseases like Pandemics
- Extreme Levels of Poverty
- Wars etc
Which will drastically reduce the Human Populations.
Criticism
Many Experts Criticised Malthus for being overly Pessimistic by citing example of
Multiple European Countries particularly after Industrial Revolution when the Resources Multiplied Many Fold but the Population was not growing in a geometric way and as a result of that, the Living Standard of People has risen instead of falling down.
Conclusion
Despite Criticism the thesis gained wide spread acceptance and ideas of Malthus were used in Public Policies, Economies & Population Targets for Various Countries.
Malthusian Theory of Population was Successful in highlighting the Importance of a Balance between Population & Resources
Demographic Transition Theory
Summary
Background
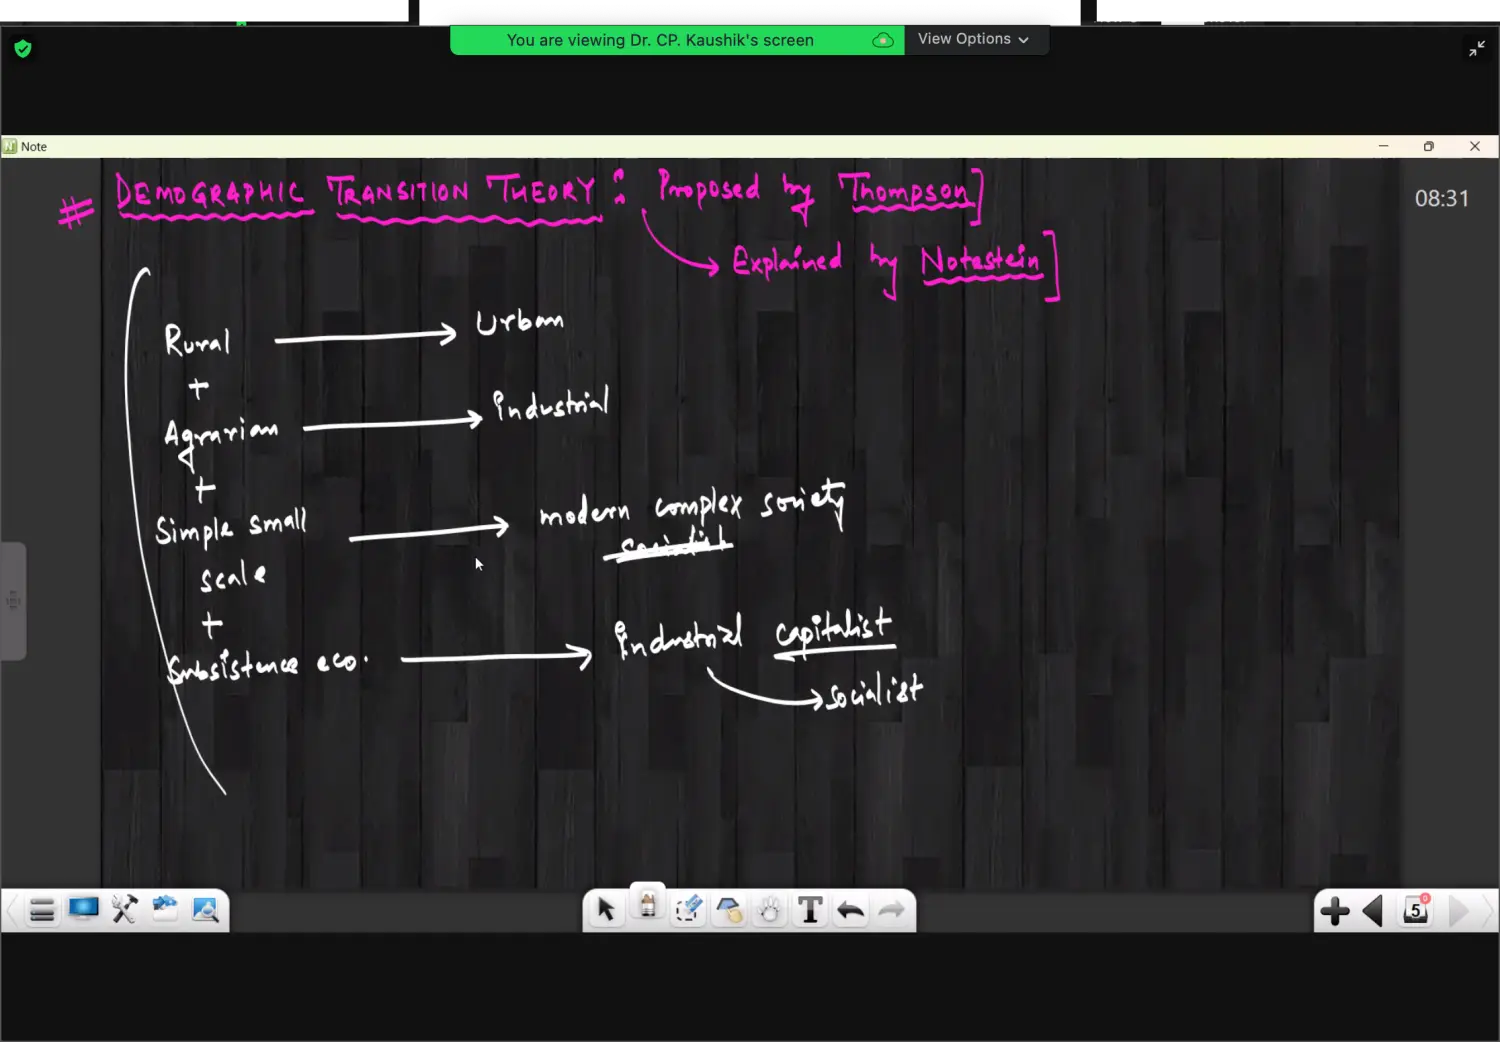
- Proposed by Thompson but explained in its classical form by Notestein
Introduction
The theory places a broad emphasis on social and economic modernisation that is a gradual shift of a society & culture from largely
Rural → Urban
Agrarian → Industrial
Simple Small Scale → Modern Complex Society
Subsistence Economy → Capitalist Economy
with these changes society will also witness, a particular pattern of population growth rate, based on changes in birth and death rates.
DTT postulates a specific pattern of demographic change towards Low Fertility & Low Mortality corresponding to changes in Societal Setup or Structure
Stages of Demographic Transition
CLASSICAL DTT
In General, 4 Different Stages of Demographic Transitions are :
Graph of 4 Stages
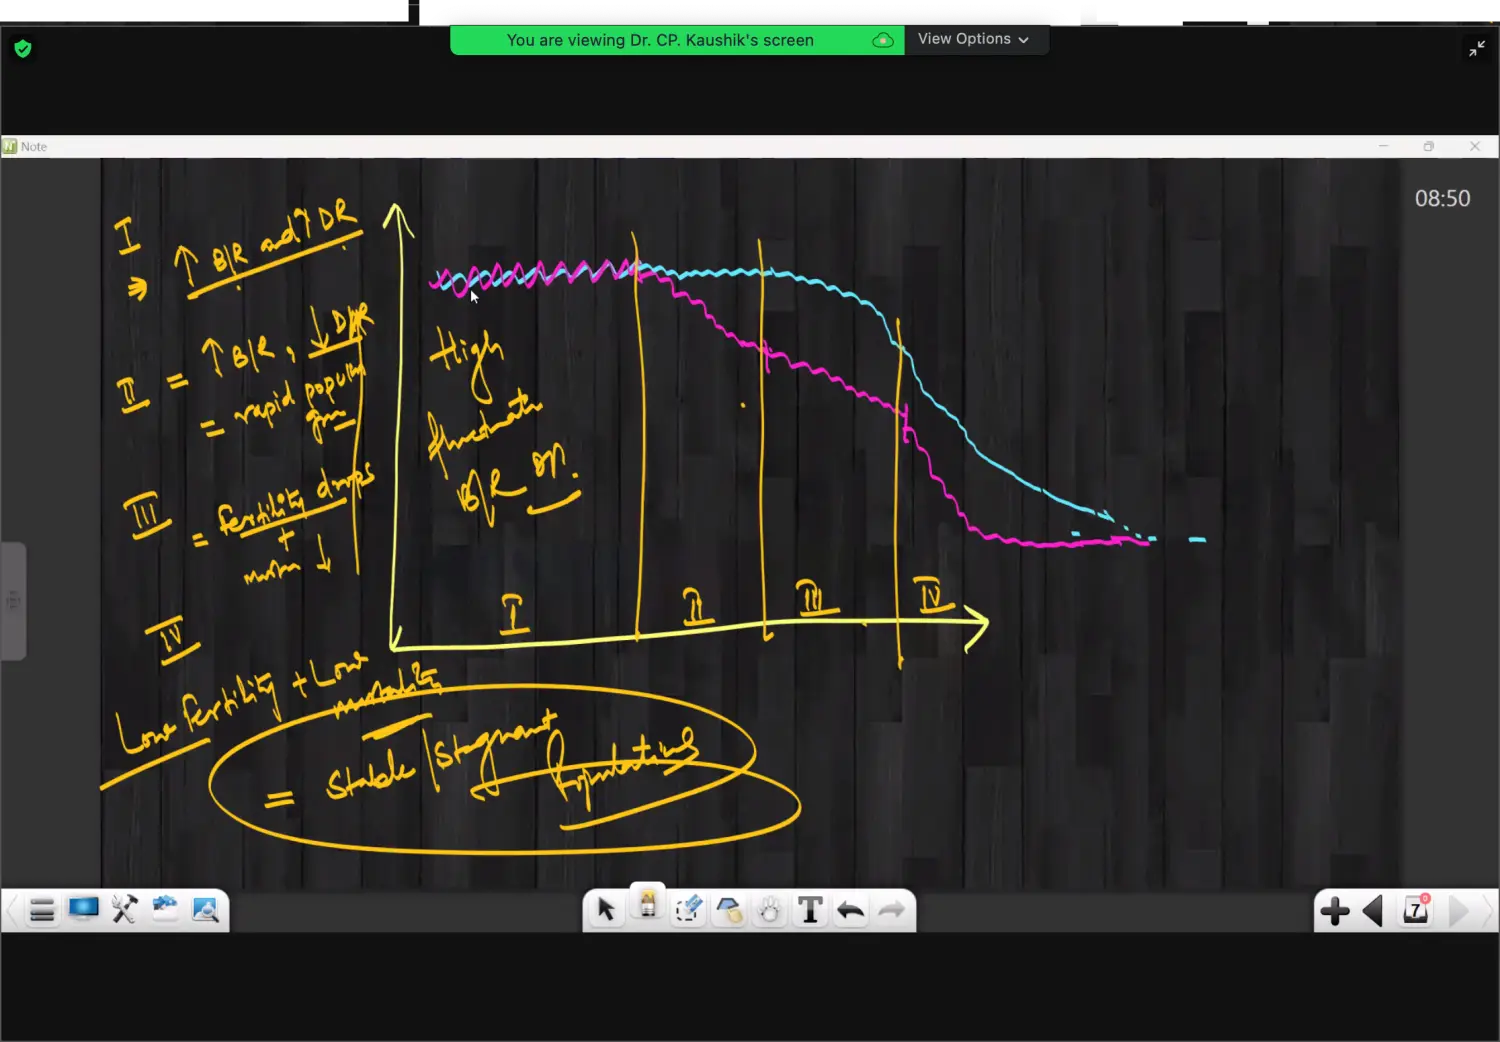
Stage 1 : Initial Phase of High & Fluctuating Birth & Death Rate
- High & Fluctuating Birth & Death Rates, Neutralising Each Other
- Dominance of Rural Population Occupied in Agriculture 7 Allied activities
- Very Low Levels of Literacy & Awareness
- Sometime considered as “Stage of Backwardness”
- Very Low Income & hence poverty of masses
- Dominance of Social Belief and Customs
- Keeps Birth Rate Very High
- Spread of Diseases & Birth Rate is High
- Due to Primitive Sanitation
- Absence of Medical Facilities
- Dirty & Unhygienic Surroundings
- So High Birth & Death Rate will have a Stable Population
- Example : Indian Society before 20th Century
Stage 2 : High Birth Rate, Decline in Birth Rate, Leading to Rapid Population Growth
- Characterised by Rapid Population Growth
- Sharp Decline in Death Rate due to Improved Awareness and Medical Facilities while birth rate still remains high
- Along with Agriculture, Initial Stages of Industrialisation Starts
- Higher Birth Rate with Declining Death Rate → Sharp Rise in Population
- Example : 20th Century India in Pre Independent Times
- Sometimes Population Explosion takes place
- Example : Post Independence India in 3 decades of 1951 to 1981
Stage 3 : Fertility Drops, Mortality Further Drops, Leading to Slowing Down of Population Growth Rate
- Population Grows at a faster rate with an ultimate increase in Population
- But Population Growth RATE starts declining
- Death Rates Further Declines Improving Life Expectancy
- So Over All Slow Rate of Population Increase
- Reasons will be
- Literacy & Awareness
- Economic & Social Development
- Govt Policy
- Competition for Resources
Stage 4 : Stable & Stagnant Population
- Stable Population with Stagnant Growth of Population
- Very Low Birth & Death Rates which are almost equal
- Example : present day china, US, UK
MODERN DTT
- Stage 5 : Addition by
- Some Experts Consider Fifth Stage of Demographic Transition also, when death rate is all most zero and birth rate is even negative
- Examples : Ageing Countries like Japan & Australia
- Example : Scandinavian Countries
Criticism
Some Experts criticised the theory with an argument that it was based on Limited Sample of European & American Society
Conclusion
- This is one of the Most accepted Population Theory & is widely used in Population Studies across the world
- It is used in Training, Formulation of Programs and Policies etc
Biological Theories
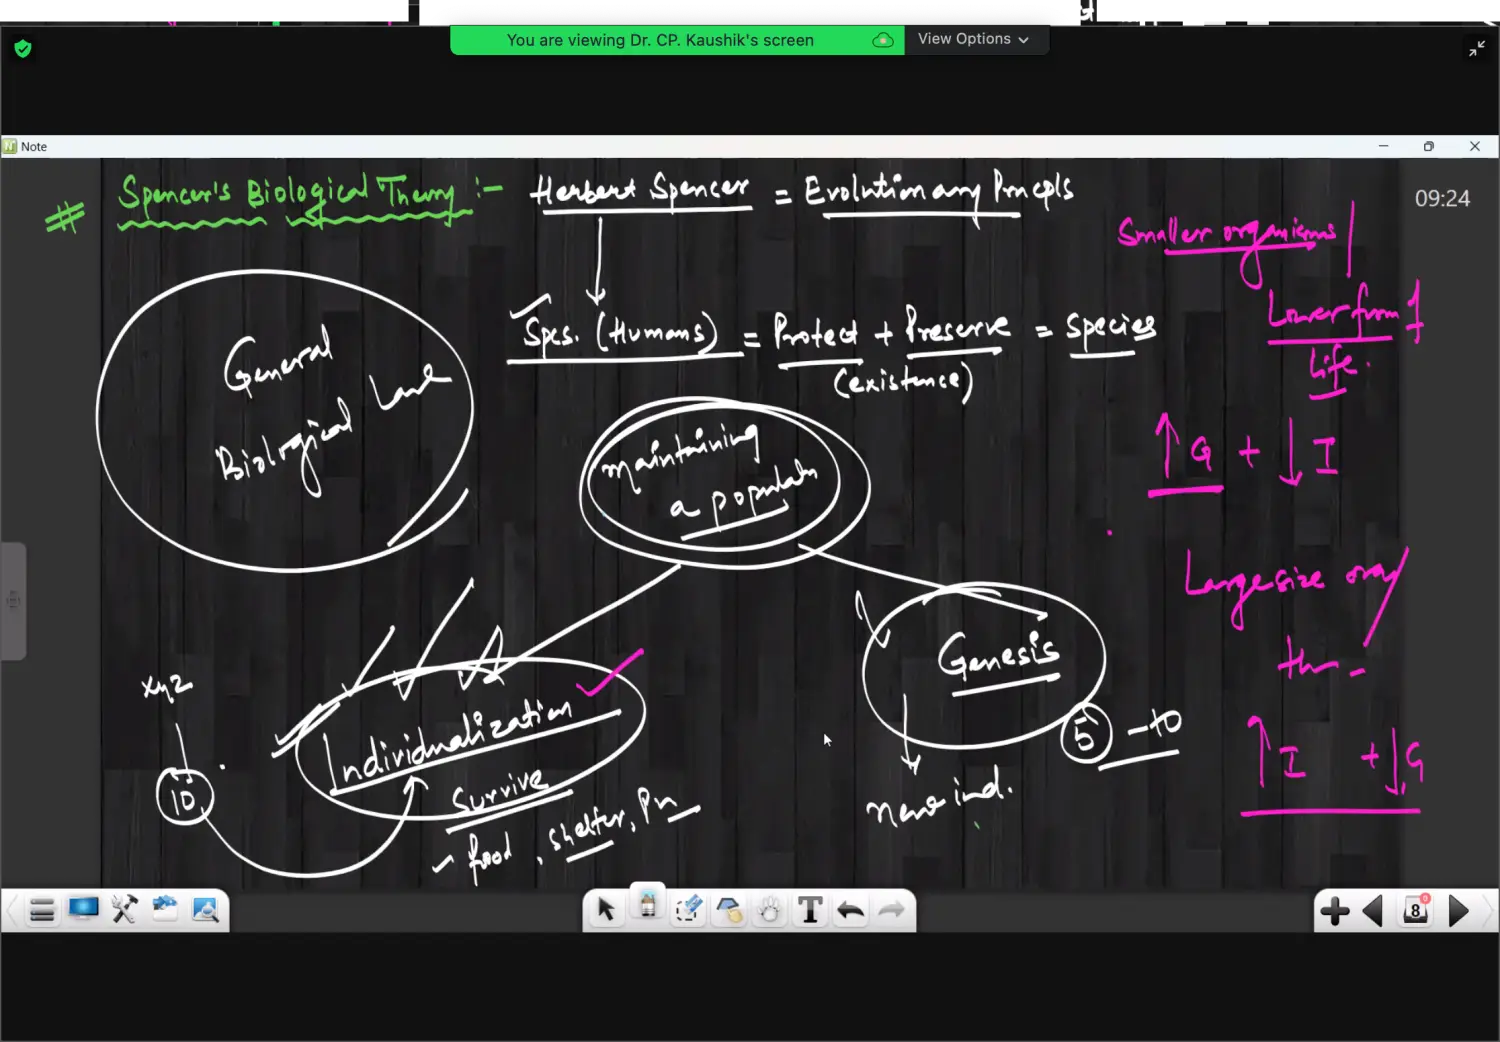
Spencer’s Biological Theory
Spencer Argued that Protection & Preservation of Species and its population is a general biological law, governing the growth of all species including humans.
Two Different Methods are used by two different species or population for maintaining their populations
Individualisation / Individuation
Ability of a species to maintain and conserve life of its existing individuals, by ensuring food, shelter, protection etc
Genesis
It is the capacity of a species, to generate new individuals
It may also be called Fecundity
Spencer maintained that
- lower forms of life and small size organisms have high genesis and low individualisation
- Higher forms of life probably, large size organisms have high individualisation with low genesis
LI - Low Individuation HG - High Genesis
By this Analogy, Spencer said that poor people, have LI & HG
Where as the rich have HI & LG
So in Various Societies, there is a Gradual Change from HG & LI → LG & HI
Spencer divided Human Population in three different groups
- Poor High Fertility Because of HG & LI
- Middle Class Correspondingly Low Fertility Avg G & Avg I
- Rich
Fairly Low Fertility LG & HI
Criticism
Spencers theory is not very much applicable in complex populations with large scale variations.
Like present US or Indian Society
Conclusion
Spencer theory was more or less accepted in countries with Lesser Populations
Background
Diet Theory by Thomas Doubleday
Background
He was a British Economist.
Theory
Doubleday Expressed his views on various Natural Laws Governing Population, According to him, population rise will be lesser, when quantity & quality of the food will be better on per capita basis
So Affluent People, will have low growth rate & hence there number will continuously decline
Poor People with less resources 7 less supply of food, will have a constant rise in population & this happens in all the societies
Those people who form Mean and Median between these two groups are called the Average Income Group will have population growth rate in between the two
Doubleday maintained that one significant reason of lesser population growth rate in affluent class is to ensure transfer of wealth and property amongst a few people.
Over a Period of time, it may happen that there will be no one as successor for wealth and property of affluent class, which will be distributed to kids of poor people
When these poor will grow rich, they will restrict the sizes of their family and this cycle will be repeated again and again.
Destiny Theory / Sadlers Theory by Thomas Sadler
Body
It was based on the book Law of Population
Sadler explained his theory based on destination of populations, settled at various geographical locations, that is
Forest Settlement
Villages & Towns
Cities & Metropolitan etc
In Forest Settlements, Agriculture and forestry based pastoral communities are there, which have large area under their habitation and hence density of population will be low
when society moves from forests and villages towards cities & metropolitans, area under habitation will decrease and hence density of population will increase. So people would restrict their family size
This will reduce the Fertility Rate and with changes lifestyle gradually the Fecundity will also reduce
Criticism
but was criticised by some experts as Sadler was not able to differentiate between fertility and fecundity & reasons associated with those changes
Conclusion
This theory was accepted in its broad sense for being optimistic in nature against the pessimism of Malthus.
Cultural Theories - Socio Cultural Theories
Theory of Social Capillarity by Dumont - Only Prominent Theory in this Category
His theory was based on studies of France after Industrial Revolution particularly in later part of 19th century.
He argued that Low Fertility in France is due to High Intellectual and Aesthetic Development of People of France
So the Increase in Number of Individuals is Inversely Proportional to Intellectual Capabilities of a Nation
In Simple Words, the direct cause of decline in birth rate, was movement from Lower to Upper Class
This is the Capillarity in Social Order
Criticism
Dumonts theory was criticised for being restricted to very small area & there are multiple examples in the world, where countries with high population growth rate contributed a lot towards scientific development
Example : Like Japan of 20th Century
Theory of Increased Prosperity by Brentano - Can Ignore Explanation just cite
- Paper 2 - Unit 2 - Demographic Profile of India
Population Dynamics in India
Facts & Figures
India has Land Area of 2.4% of the World
India has Population of
- 17.6% (approximate for 2025)
- 16.7% (exact for 2011)
- Meaning every 6th person on earth is an Indian
By 2027 India > China
Growth Rate (2001-2011) = 17.6%
- 2011 - 2021 - 13/14% → (Rough Estimate by Niti Aayog)
- 1991 - 2001 - 21.4%
- 1981 - 1991 - 22.0%
- 1971 - 1981 - > 24%
- 1961 - 1971 - > 24%
Inference
- Population Keep Increasing but
- Population Growth Rate - Starts to Decline
Why there is such high Birth Rate in India ?
- Economic Factors
- Poverty in India → Labour is an Economic Asset → More Number of Kids → More Labours
- Land Reforms After Independence
- Slow Rate of Urbanisation & Industrialisation
- Limited Participation of Women in Workforce
- Women’s Less Say in Decisions of Family Planning → Crime of Repeated Pregnancy
- Social Factors
- Unawareness / Illiteracy
- Child Marriages
- Son Meta Preference → Imbalanced Sex Ration
- Joint / Extended Families → More Members to take care of Kids
- Religious Factors
- Taboo Related to use of Contraceptives
- Wrong Notion of Kids being the Gift of Almighty
- Insecurity in the minds of Minority
- Political Factors
- Lack of effective implementation of population control programmes, like family planning.
- Vote Bank Politics in Caste & Religion
- Fixing Parliamentary Constituencies based on 1971 census data w/o incentivising and balancing better performing states (particularly southern states).
- Added to Increased Birth Rates at Specific Pockets
- All Southern States have brought total fertility rate to the levels of replacement ratio.
- Explanation
- 1971 Census Data - Parliamentary Constituencies
- Southern States have worked better in bringing TFR to Replacement Ratio
- Hindi Heartland has High TFR Inc && BR Inc
- 1971 Census Data - Parliamentary Constituencies
- Non Seriousness of States towards NPP, 2000 ( National Population Policy, 2000 )
- Events of Forced Sterilisation in 1970’s resulting into counter effects & resentment in the public towards family planning
- Economic Factors
High BR + + Decline in DR = Highest Rise in Population
Reasons for decline in Death Rate ?
- Better Health Infrastructure
- Progress in Medical Science
- Control on Epidemics like Small Pox, Plague, Cholera etc
- Improved Economic Status of Population → Improved Literacy & Awareness + Better Nutrition
- Govt Measures
- Like Prohibition of Child Marriages
- PCPNDT Act, 1994 → Blocked Sex Selective Abortion
- Food Security Act, 2013
- Industrialisation & Globalisation & Urbanisation → Impacting the Awareness, Literacy, Economy etc
- Improved Hygiene & Sanitation
- No Major War Like Situations
Various Population Policies
- 3rd Five Year Plan (1961-66)
- Had Community Extension Approach
- Primary Health Centres to be Established which will guide people towards family planning
- Focused on Child Education (especially on Girl Child Education) & on Child Nutrition
- Community Campaigning + Civil Society Participation → raise awareness for Family Planning & Benefits of Small Family
- National Population Policy, 1976
- Freezing the Parliamentary constituencies based on 1971 data
- Increased Marriageable age of girls from 15 to 18 years and for boys its 18 to 21
- Eight Percent of Budgetary Allocation diverted towards states for Family Planning
- Dr V A Pai Panandikar, 1978 - Working Group on Population Policy
- reduce the average family size from 43. Children to 2.3 (Targeting a reduction of 2 units)
- Population Stabilisation → by 2050 India’s Population should not breach 1.2 Billion (Breached as per 2011 Census as Population was 1.21 Billion)
- Net Reproductive Rate should be 1 by 1996 (in 1978 it was 1.6) but as per 2011 census it is 1.3 to 1.4
- To achieve birth rate of 21/1000 on annual basis by 2025 based on International Targets of UN.
- Swaminathan Expert Group Group on Population Regulation, 1994
It formed the basis and guide for NPP, 200
It proposed the formation of 2 types of targets, namely :
- Immediately Achieved - 10 Yrs
- Medium Terms - 10-30 Yrs
- Long Terms - 20 - 60 Yrs
Expert Group Suggested soft points like
Motivation & Sensitisation of Population by means of {Media, Civil Society & NGO’s} targeting areas having {Target Groups + Area} to adopt family planning
for this there should be Liberal Supply of Contraceptives
Other Incentives
- Like Priorities in Jobs to those who adapt small families
Health Standards focus should be on Only
- Maternal Health
- Child Health
Minimise Sterilisation
- Contraception
- IUD’s - Intra Uterine Devices & IUCD’s - Intra Uterine Contraceptive Devices
- Example : Copper T & Female Condoms
- Pills etc
- National Population Policy, 2000
Background
- This was the First True Draft of Population Policy in India
- This was guided by Report of Swaminathan Expert Group
Broad Objectives
The Policy had objectives had 3 different levels to be achieved
- Immediate Objective - Day 1
- to fulfil the unmet needs of
- contraceptives
- health infrastructure
- integrated service delivery for basic RCH - Reproductive & Child Health Care Services
- by promoting institutional deliveries, vaccination & nutritional supplements for mother and child
- to fulfil the unmet needs of
- Medium Term - by 2010
- to bring the TFR to 2.1 by by 2010
- Long Term by 2045
- to achieve a stable population by 2045 to achieve a demographic transition
- Immediate Objective - Day 1
Other Targets of NPP, 2000
Diagram
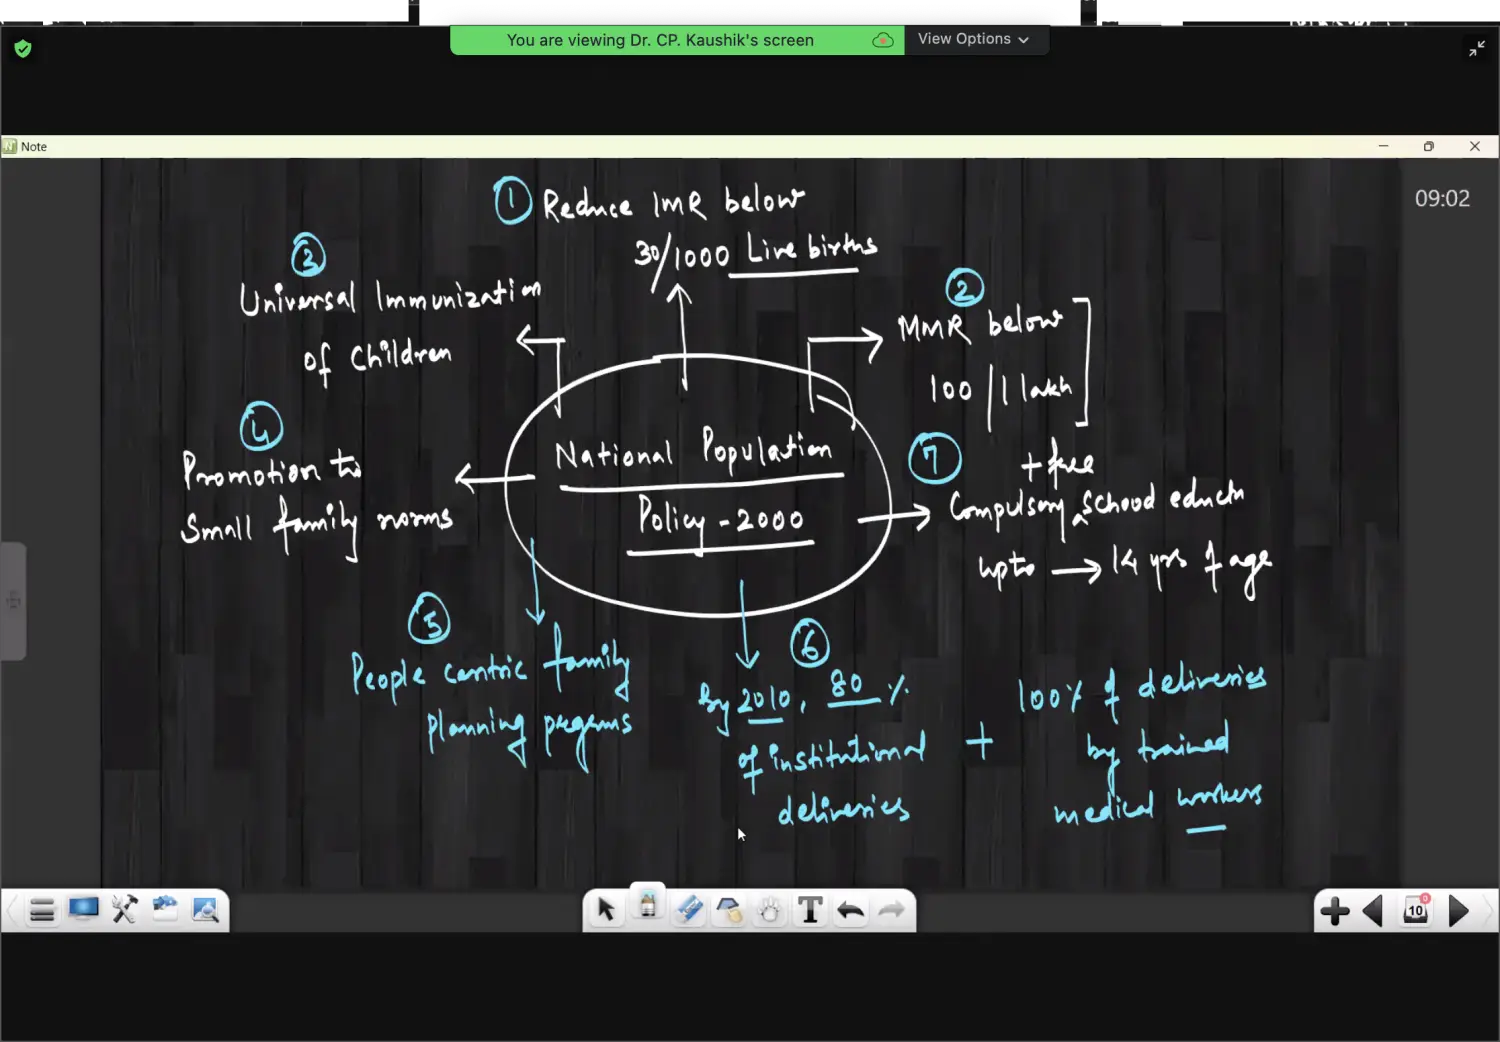
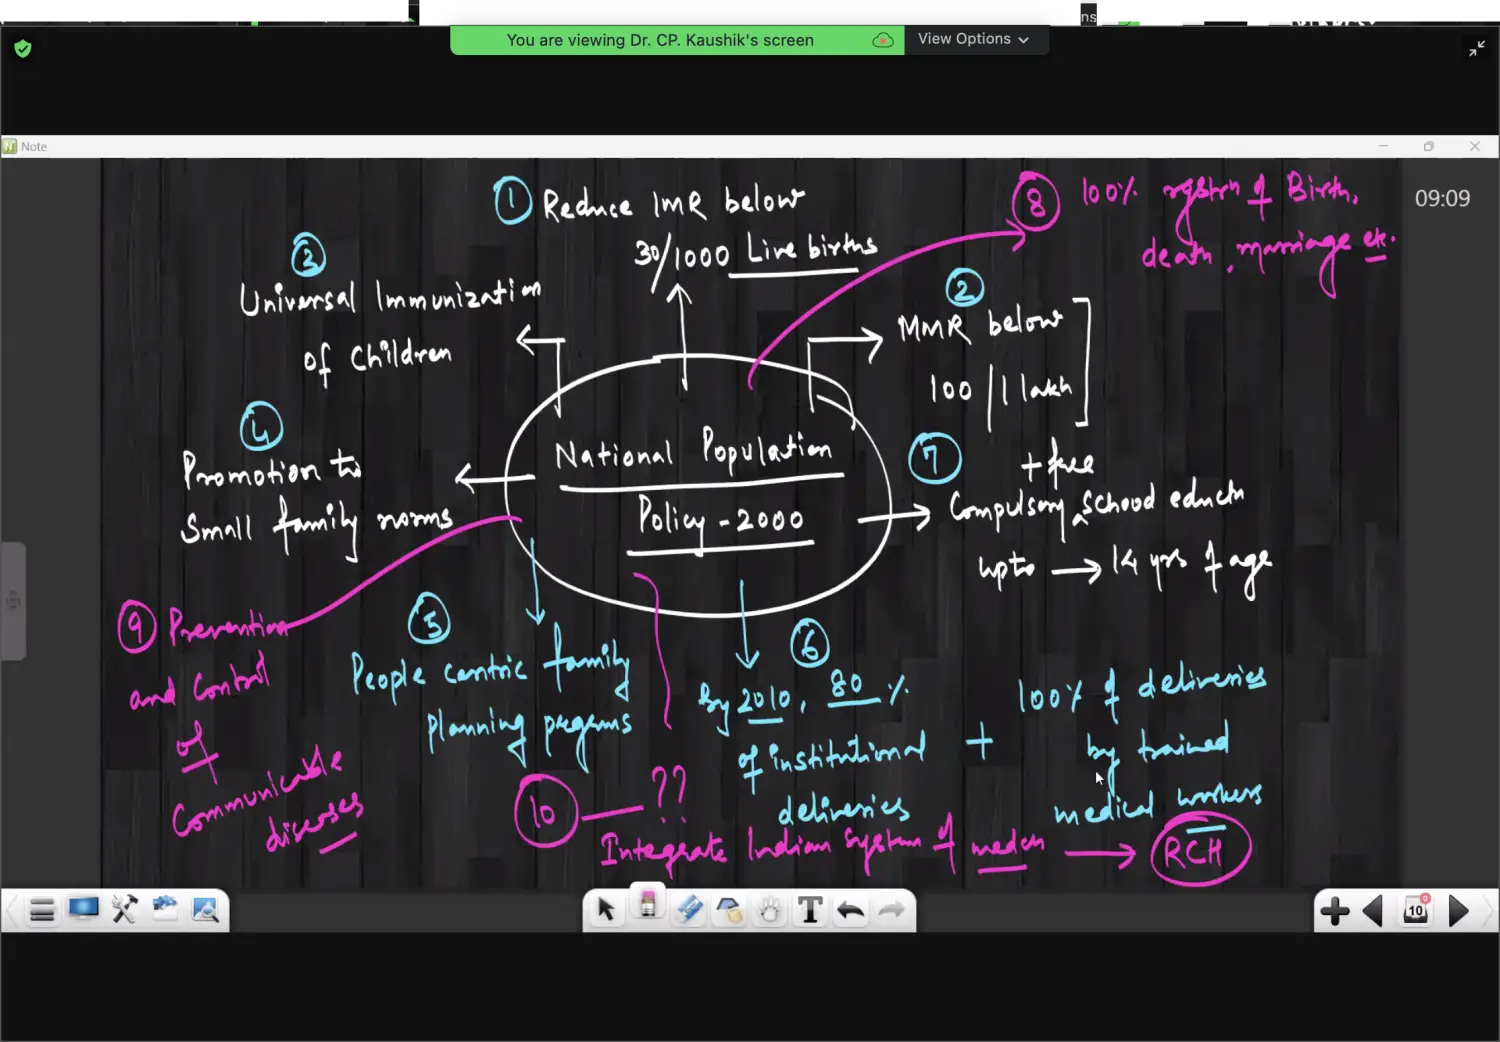
Written - All 10 Points should be remembered
- Reduce Infant Mortality Rate below 30 per 1000 liver births
- Reduce Maternal Mortality Rate below 100/1 Lac
- Universal Immunisation of Children
- Promotion to Small Family Norms
- Compulsory & Free School Education upto 14 Years of Age
- People centric Family Planning Programs
- By 2010, Deliveries
- 80% Institutional Deliveries to be achieved
- 100% Deliveries by Trained Medical Workers
- 100 Percent Registration of Birth, Death & Marriage etc
- Prevention and Control of Communicable Diseases
- Integrate Indian System of Medicine in providing reproductive & child health care services
- 3rd Five Year Plan (1961-66)
World Population Prospects Report, 2019
Parameters Highlighted by this Report
India will be most populous country of the World by 2027
by 2050 India’s population will be 1.64 Billion
Demographic Advantage will peak around 2047 in India
After that India’s population will start ageing, like present day Japan & Germany
This Ageing Population will be a Burden on Govt, like based on
- Pension
- Health Challenges
- Wont be contributing much to economic growth
Technological Advancements like New Innovations will also be reduced
Backdrop
- Warning to India for the comings of time, hehe !
Role of Anthropology in Population Management
A Conference on Population Studies was held in 1973 at OSHKOSH, USA recognised the importance of anthropology in population management
- Cultural Core for Policy Making
Any Population Program and Policy not considering the cultural values and beliefs, will have limited success and sometimes can yield results in opposite direction
- Anthropological Field Work
Field work study in anthropology develops a rapport with local people and can win their confidence, so the apprehensions of local people can be better understood and objectives of programs can be easily explained
- Better Understanding of Reproductive Customs
Beliefs and customs concerning reproduction can be better understood by Anthropological research. Instances like
- Religious Dogmas
- Practises of Polygamy
- Taboo related to use of contraceptives
can be well understood with anthropological knowledge
- Action & Applied Anthropology
Action & Applied Anthropology give an idea about specific population tribes castes etc. Their social norms, health indicators, disease patterns etc can be well communicated to the authorities and people
- Conclusion
Various Anthropological Studies during British India Times ( H S Risley, S C Roy, Grierson etc )
and after Independence by various American anthropologists, Indologists and indian anthropologists, contributed towards formulation and implementation of population programs in India
Racial Ethnic & Linguistic Composition of Indian Population
Ethnicity & Race
Ethnicity
- Running Notes
Ethnicity
- Ethnicity is derived from Ethinikos meaning National
- Clifford Geertz defined Ethnicity as : Expression of Primordial Attachments
- Expression of Primordial Attachments can be
- Biological - Physical
- Socio Cultural - Language, Customs, Rituals
- History of Colonisation in and Migration from same geography is also called ethnicity
Ethnic Group
An Ethnic Group & Individuals Present in the Group are connected by
Expression of Primordial Attachments can be
- Biological - Physical
- Socio Cultural - Language, Customs, Rituals
Race
- was defined by Hootan
- Ethnicity is Theory and Race is Application of it
- Race is the Great Division of Man Kind
When we talk about human variations race and ethnicity are used in interchangeable basis
In General Ethnicity represents groups sharing common Identity based on Ancestry, Language, Culture
Ancestry, Language, Culture → Religion, Beliefs Customs & Memories of Migration or Colonisation based on same geography
Ethnicity is derived from Ethinikos meaning National
Clifford Geertz Explained the term Ethnicity “as an expression of primordial attachments” based on common biological or socio cultural traits
Biological - Physical, Physiological, Genetic etc
Socio Cultural - Language, Culture, Rituals etc
Apart from this an Ethnic Group is also usually characterised by
- a sense of community
- feeling of ethnocentrism
- emotional connect with the individuals of same community
- Running Notes
Race
Race is Anthropologically or Socially constructed term to identify human population characterised by specific physical or social traits.
In the words of Earnest Hootan, “Race is a great division of mankind” the members of which, though individually varying, are a common group.
With Matching Morphological or Metrical Features (measurements)
How did the Indian Genetic Pool Got Diverse ?
People having different racial and ethnic elements have been coming and settling in India from very ancient to very recent times and most of them never went back leading to mixing up of genetic pool with local populations
giving rise to diverse ethnic and racial elements of Indian society
diverse → This has resulted in a Colourful Mozaic of Human Affairs, that the Indian Society is today (ASI)
What are the Sources to study races & ethnicity ?
Unfortunately very less archaeological evidences are available to study these races scientifically.
Stone tools are the Most Important Source to study these different races as skeletal remains are rarely found. Its very difficult to construct a racial history based on them(skeletal remains)
Racial Classification of India & Allied Debate
Herbert Hope Risley - Racial Classification for India
Running Notes
Criteria
- Stature Natural Height
- Nasal Index Nasal Width as a %age of Nasal Height
- Cephalic Index %width/breadth to length of Skull
- Orbito Nasal Index
Core Races- 3 Categories
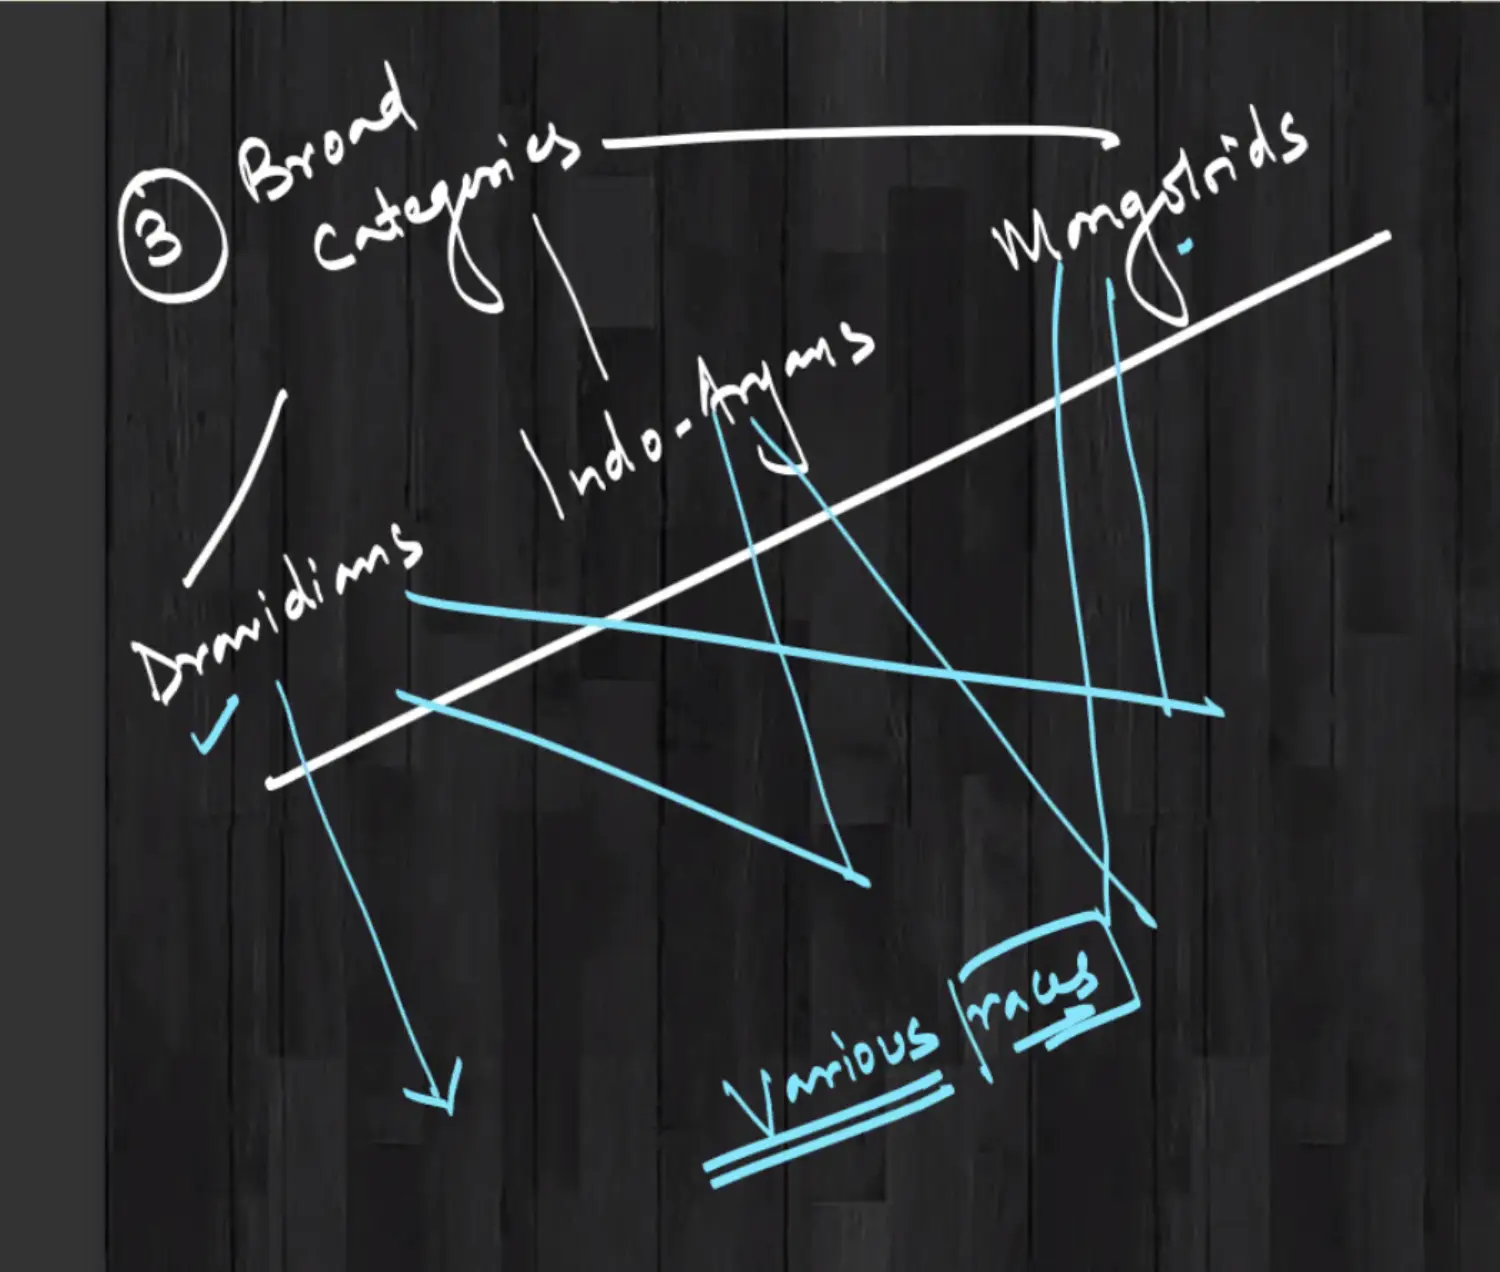
Transformed Into - 7 Categories
- Dravidians
- Indo Aryans
- Mongloids
- Monglo Dravidian
- Anglo Dravidiain
- Scytho Dravidian
- Turko Iranians
Meaning of Scytho
Synthians is generally used for people belonging to Ukraine, Southern Russia They went to Central Asia -> Iran
Chronology
1881 - Started Work in
1901 - Part of Census
1905 - Used by Govt
1915 - Book Published
Introduction
Book : The People of India, 1915
Probably the First Scholar to have attempted Racial Classification of India on Scientific Lines based on Anthropometric Techniques
Parameter of Classification
4 Different Anthropometric Parameters used by Risley to Classify Indian Races
1 Stature
- Natural Height of Individual based on Genetic and Environmental Factors
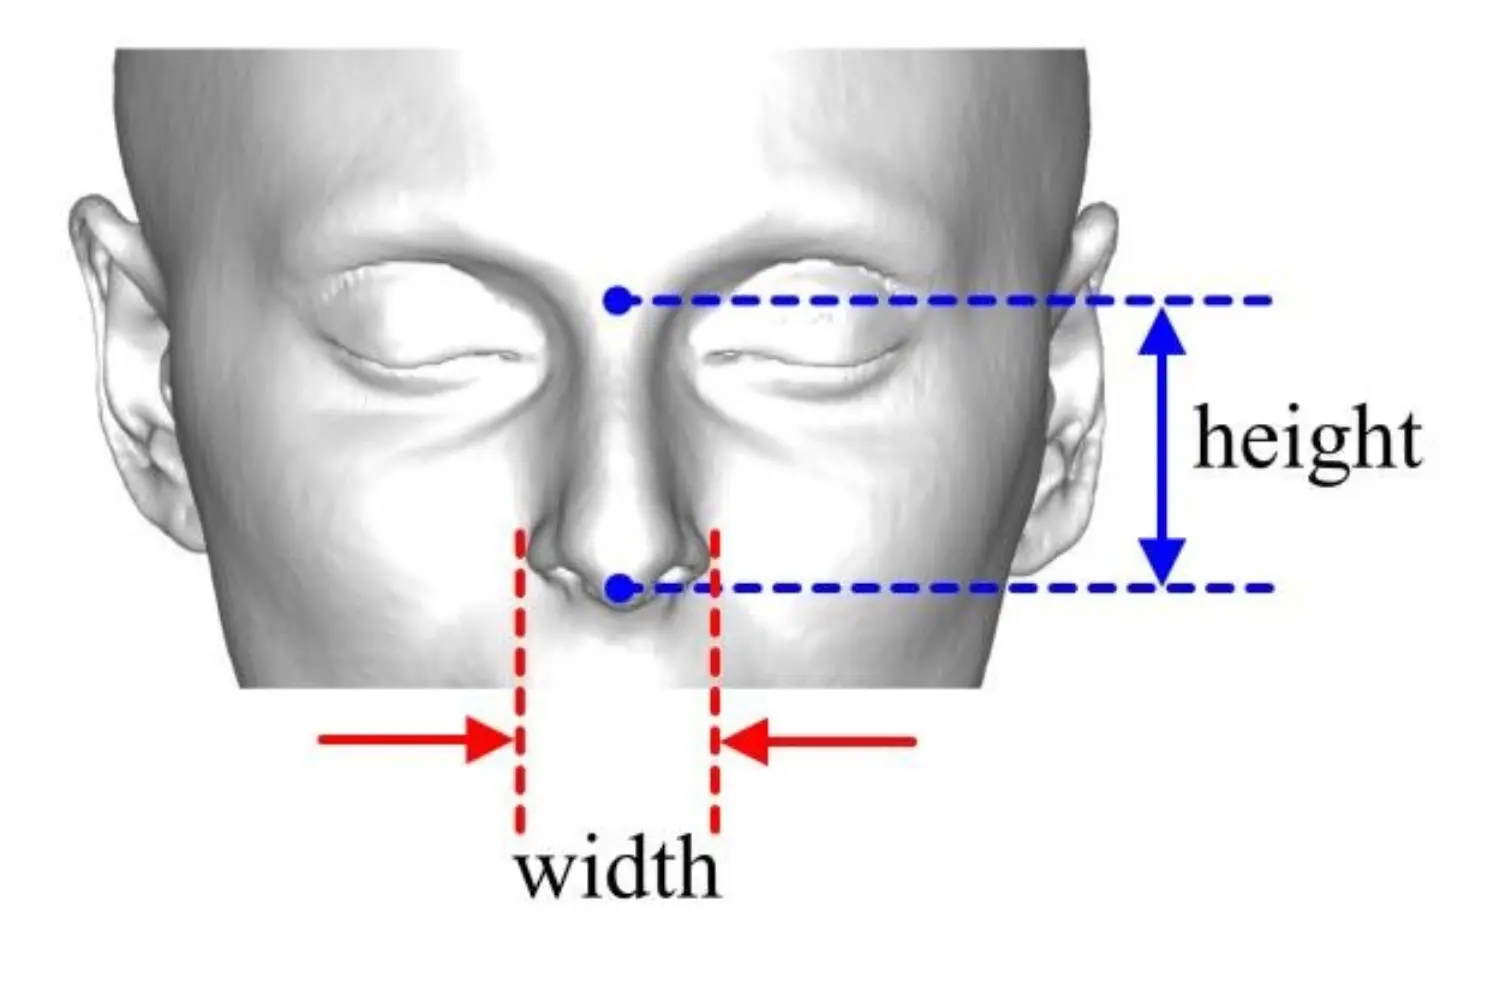
2 Nasal Index
- Depicts Nasal Width as a Percentage of Nasal Height
Image
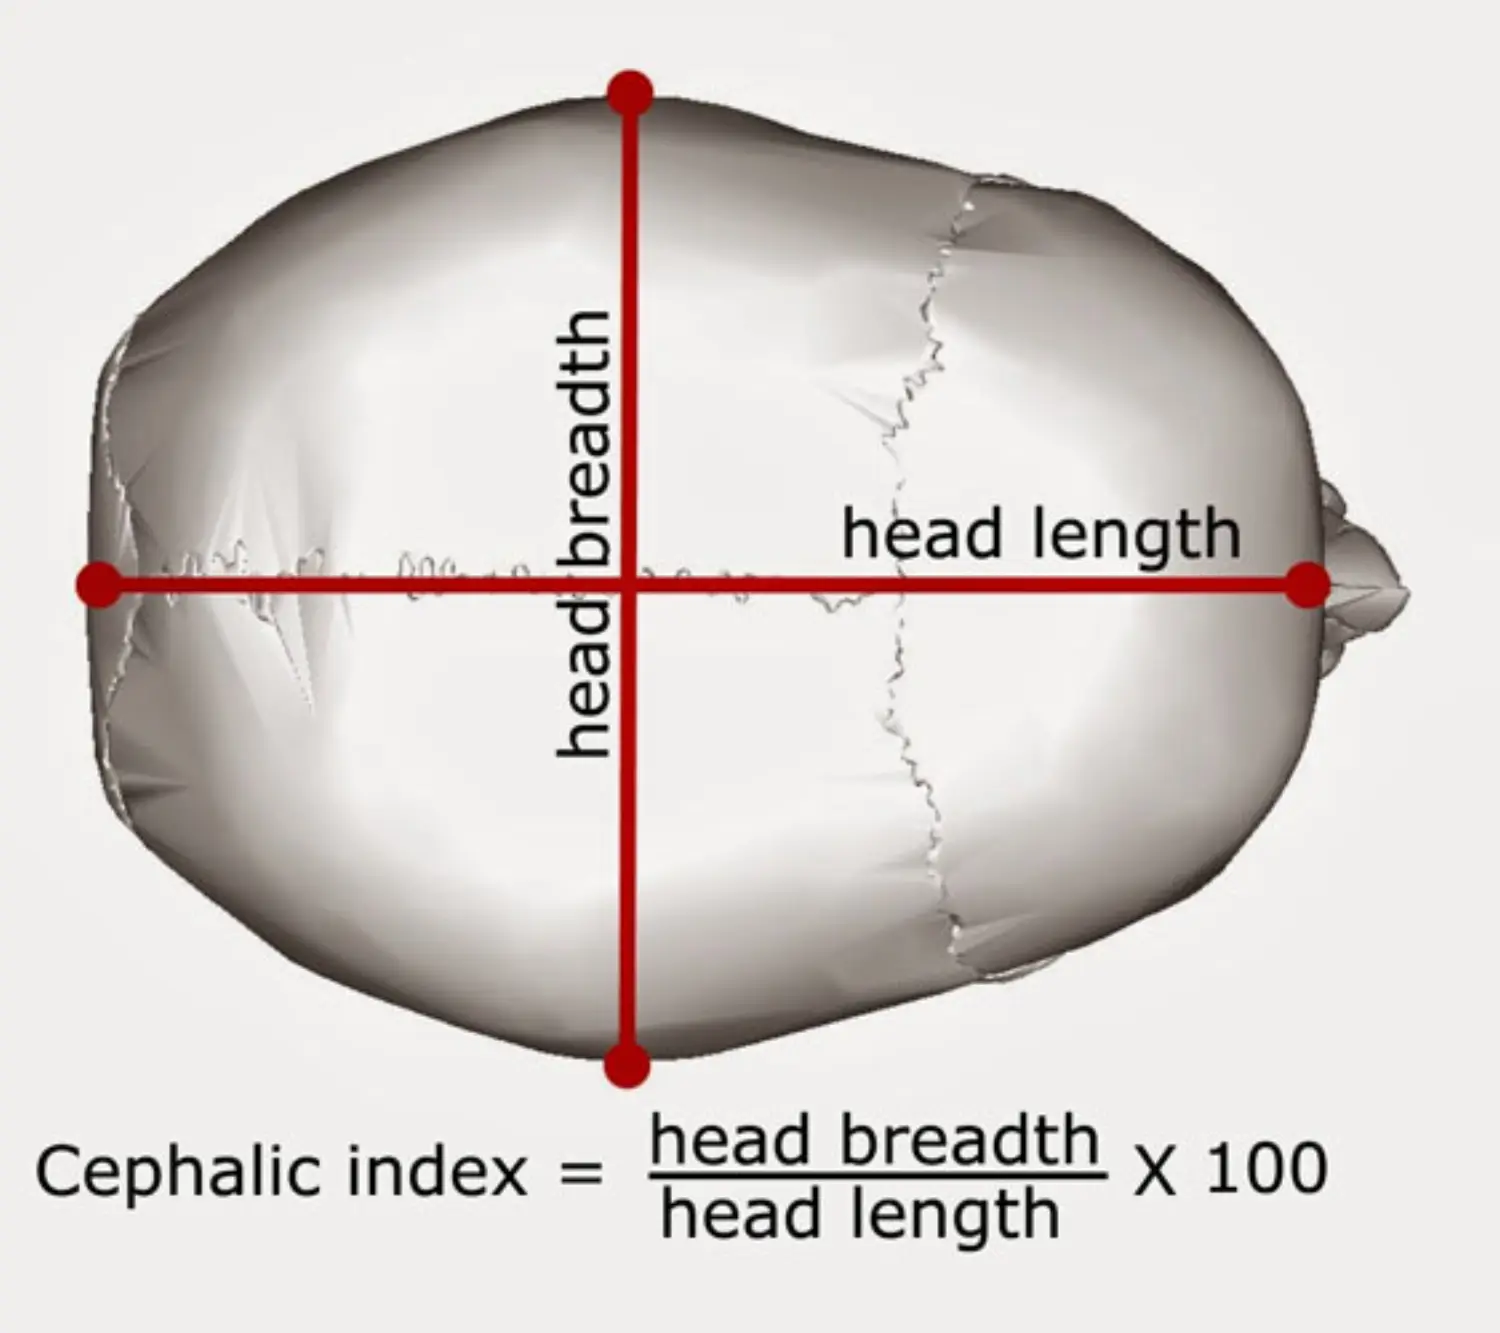
3 Cephalic Index
- It is the Proportion or Percentage of
- Width or Breadth of Skull - Measured from Behind Ear to the same position on other side
- to the Length or Diameter of Skull - Measured from Frontal Convexity to Occiput
Image
4 Orbito Nasal Index
- Ratio of Lateral Index of Eyes Measured in Context of Root of Nose
- Image
3 Different Principle Races
Based on these Parameters Risely Identified 3 Different Principle Races in India
- 1 Dravidian
- 2 Indo Aryans
- 3 Mongoloids
These got mixed up in varying degrees in different parts of India to form some further racial types.
7 Different Physical Types
As a result, 7 Different Physical Types of Indian Populations can be witnessed
- Dravidian
- Indo Aryans
- Mongoloids
- Mongolo Dravidians
- Aryo Dravidians
- Scythian Dravidians
- Turko Iranians
Criticism
No Study beyond Assam Plains Didn't Study Parts beyond Assam Plain, Hence Study of Mongoloids was almost incomplete
Extra Importance to Scynthia Risely has Given Much Importance to Scythian Elements in Scyntho Dravidian type, but in reality Scythian Invaders Stayed for short period of time. There was no such remarkable influence of this race on india can be witnessed
Indo Aryan Place Risley Considered Indo Aryans Mainly Confined to Punjab, Rajputana and Kashmir Region but in reality are scattered to much larger area of Indo Gangetic Plains, even in north of Deccan
Criticism of Deniker Deniker was one of the Foremost Critique of Risley’s Classification Mainly for Considering Dravidians, as the only original inhabitants of India.
Also Risely Considered only one type of Dravidians, based on physical features. In Reality there are Two Physical Types of Dravidians can be witnessed even without any racial intermixing
Type 1 - LH + MS + NN
Long Head, Medium Stature, Narrow Nose
Type 2 - LH + SS + BN
Long Head, Short Stature, Broad Nose
B S Guha - Racial Classification for India
Background
- Racial Classification was based on Tribal Population
- Done on more than 2500 Individuals
- Used 18 Anthropometric Measurements, focusing mainly on cephalic and facial measurements
6 Different Racial Classes used by Guha
- Division
- Negritos
- Mongoloids
- Paleo Mongoloids
- Long Headed
- Broad Headed
- Tibetan Mongoloids
- Paleo Mongoloids
- Proto Australoids
- Nordics
- Western Brachycephal
- Alpinoids - Caucasians
- Dinarics
- Armanoids - Caucasians
- Mediterranean - They Match with Middles East, They are NOT from there !
- Paleo Mediterranean
- Mediterranean
- Oriental Mediterranean / Orientals
- Division
Criticism of Guha’s Classification
- Keith opposed Guha’s classification for the point that Maximum Racial Elements in India are of Foreign Origin
- Presence of Negrito Element in Indian Populations is a point of Debate & many anthropologist, like doctor Sarkar & Saha suggested that, some matching features with Negrito could be the result of some independent mutations
- Dr Sarkar critiqued Guha for Brachycephalic & Mediterranean element also as these are very less represented in Indian Population.
The Negroid Problem or The Debate of Negrito Element in India
- B S Guha identified Kadars of Anaimalai Region, Baniyas of Southern India, Irulas of Tamil Nadu & Tribal Population of Andaman & Nicobar Islands as having Negrito Elements
- Racial Classification of People based on Morphological/Physical Features is an Important aspect of Ethnological Studies & these features guided anthropologist like Guha and Hutton, to consider presence of Negrito element in India, Matching with Pigmis and Bushman of Africa
- Hutton Identified Agami/Angami Nagas of Nagaland as having significant Negrito Elements like their Intensively curly hair and brown complexion
- Not only these biological features but some socio cultural practises like head hunting disposal of dead by exposure match with African Negroid
- Many Anthropologists and Ethnographers like Dr Sarkar & Saha, didn't accept the presence of Negrito Elements in Indian Populations with arguments like some matching body features (intensively curly hair) can be due to some independent mutations also can be due to presence of various races and groups
- This Debate of Presence or Absence of Negrito Element in Indian Population can be justified with advanced genomic research scientific study of fossil evidence etc
Linguistic Elements in Indian Populations
Languages are Intangible Culture & Heritage of India
Running Notes
- from 1903 to 1928 - Grierson Studied Indian Languages
- India has 179 Languages & 544 Dialects in India
- Out of these 179 Languages
- 140~150 are found in → Himalayan Region & Dense Forest Area
Introduction
Grierson from 1903 to 1928 collected scientific data for Indian Languages & Dialects.
No of Languages found were 179 with some dictionary and no of dialects were 544 without some significant dictionary
Number is huge, because of different ethnicities races, geographical locations, impacts from outside etc
More than 140 Lang & Dialects are associated with
- Tribal Speakers of Himalayan Belt
- Other hilly areas
- Dense forest of North East
These Languages & Dialects can be broadly clubbed into 4 different Categories
- NISHAD Austro Asiatic Languages Family Spoken by Nearly 1.4%
- KIRAT Tibeto-Chinese Burmese Family Spoken by Less than 1%
- ARYANS Spoken by Nearly 73% of Indian Population
- DRAVID Spoken by 24% of Population
It is not known that how these language family moved to India, but it is more or less and accepted facts
That Languages of Negroit People who entered India along with Asian Coastline were amongst the first ones, but later hot subsumed with Majority Languages
Even the Chronological Order of Languages and Dialects, within these Larger Families is NOT Clearly Understood, except the Aryan Family Group.
Thats why, various Linguists say that Aryan Languages are latest out of these 4
Summary of Description
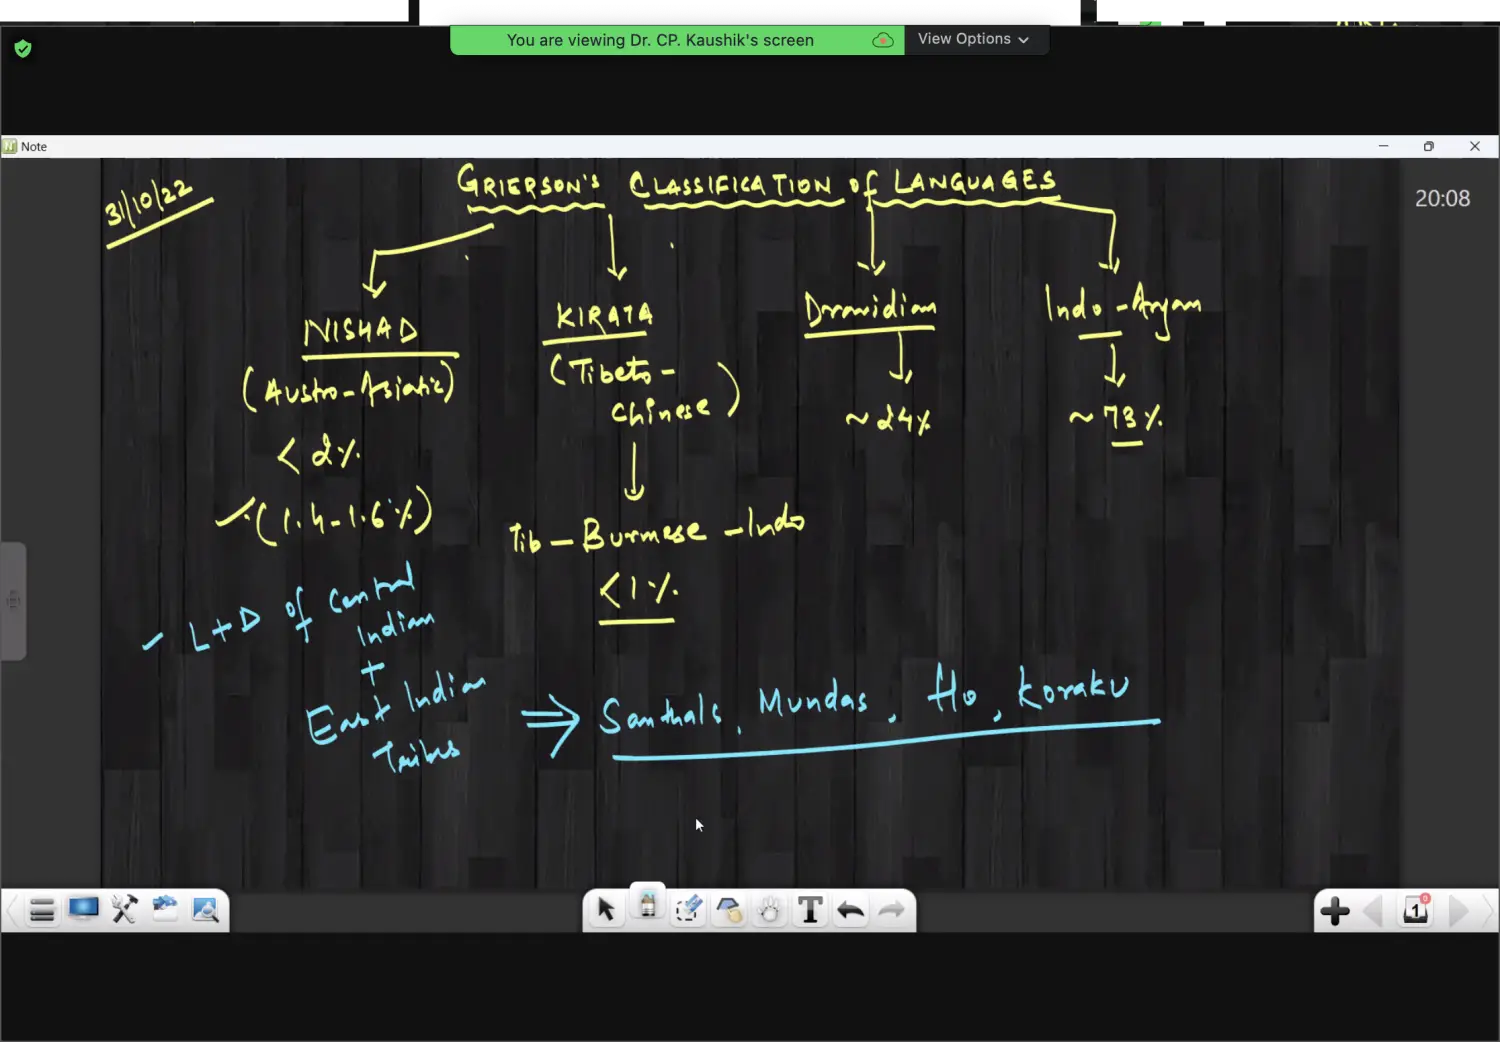
1 NISHAD
Running Notes
- Less than 2% Spoken
- Approx 1.4% to 1.6% Spoken
- Found in
- L+D Cental Indian
- East Indian Tribes
- Khasi Hills
- Racial Group is Mongoloid
- Language & Dialects is of NISHAD (Austric Languages)
- Spoken by Santhal, Munda, Ho, Koraku
- Origin - 2 Hypotheses
Blend of → Indo Chinese && South China
Mediterrenean Impact
During very old times, mediterrenean people came to india and settled here
Class Dictation
Origin of this group of languages and dialects is considered based on 2 different streams.
One Mixing up of Indo Chinese Dialects with Languages of Southern China
Second Stream is based on the argument that, in very old times mediterrenean people came to India and settled over here, giving rise to a different group of dialects which are of western origin.
Present Day Austro Asiatic Languages & Dialects are an Outcome of Mixing up of Various Elements of Dravidian & Aryan Group of Languages with the Austro Asiatic Group.
It is generally accepted that, these languages and dialects emerged in India, even before dravidian group, in some parts of north east india like khasi hills popualtion is mongoloid but there dialects are Austric in nature. Belonging to Nishad Group.
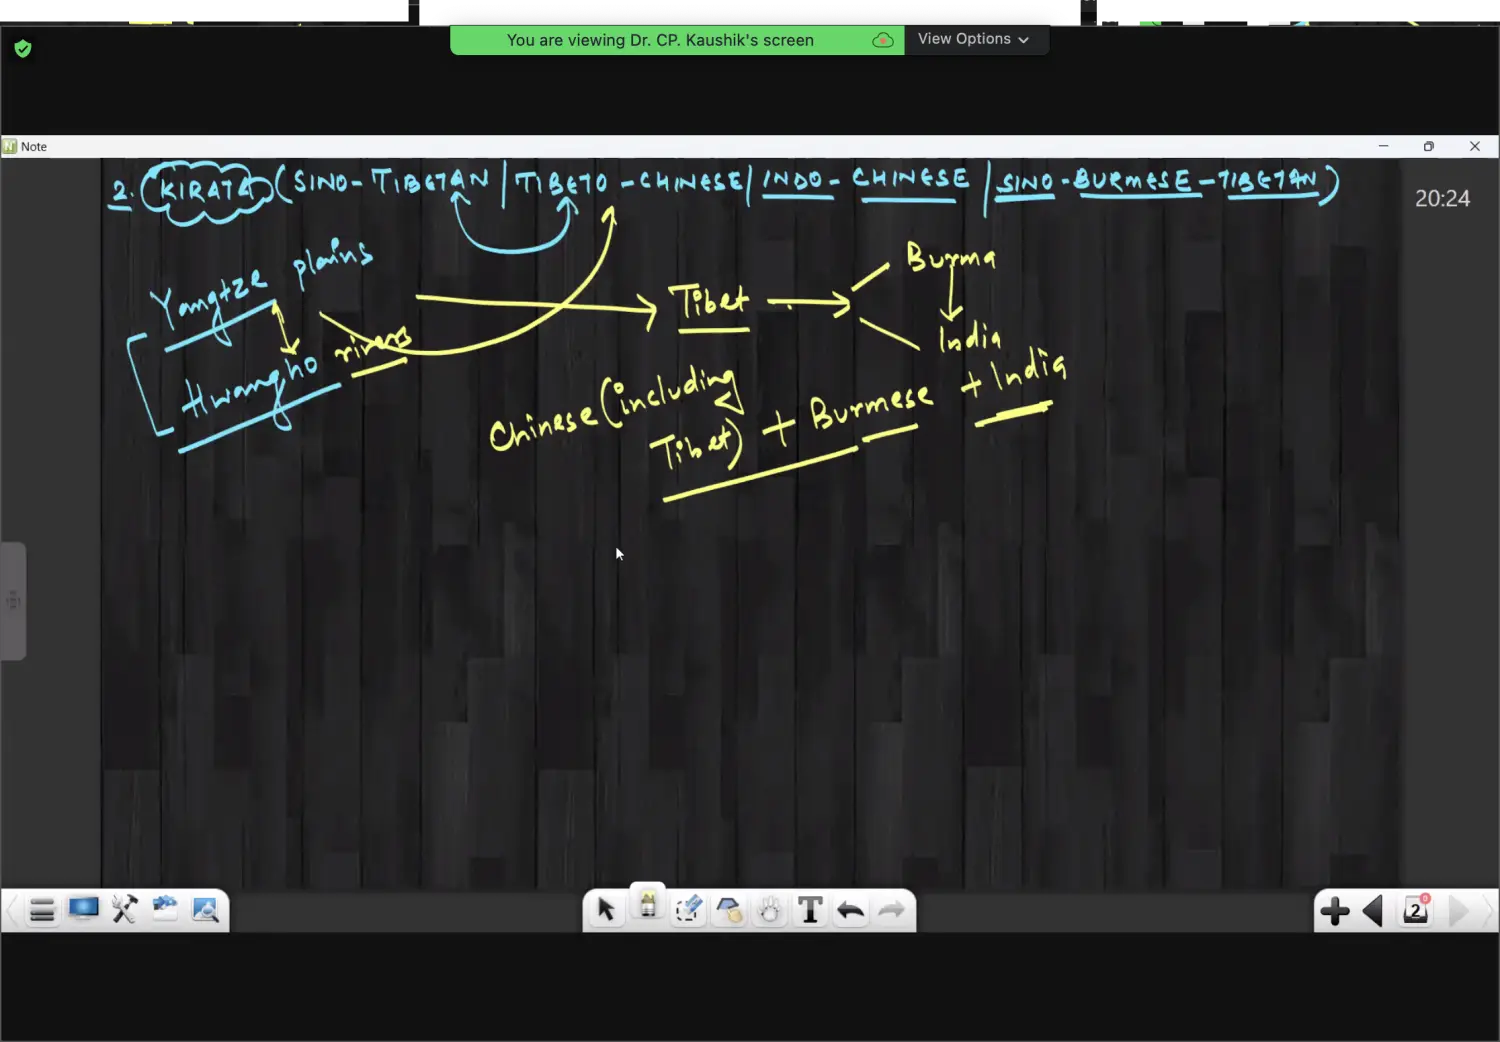
2 KIRATA
Running Notes
Yangtze & Hwangho
- Yagntze Plain - Like Indo Gangetic Plains
- Hwangho Plain - Has a Plain to
Point of Origin of Kirata Language
- Their Origin is in Between Plains of Yangtze & Hwangho plain
- from there they filtered to Tibet
- and then Tibet to - Burma & India
- then from Burma & India
The Hierarchy
Aryans when first met with Tibeto Burmese Population
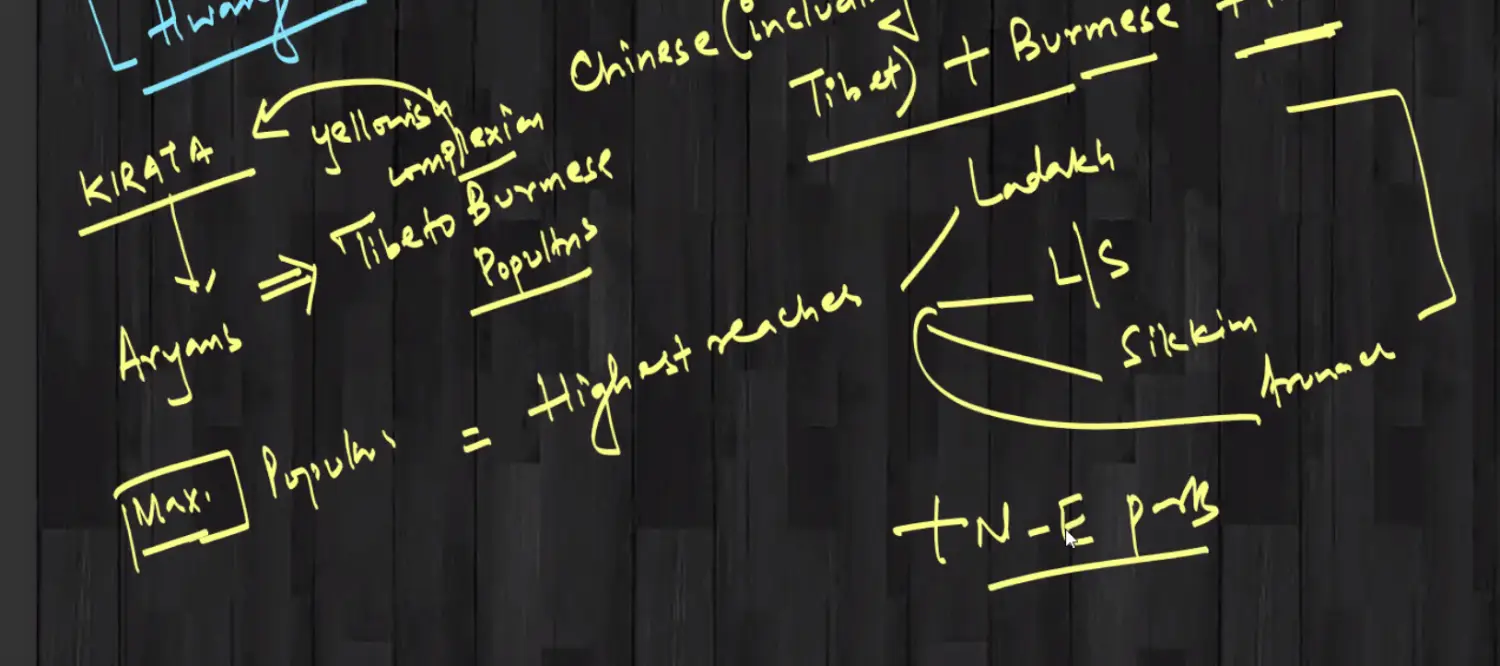
Range according to Grierson was : Baltistan (West) to NEFA (East)
Dictation
Names
- Sino Tibetans (Sino Means Chinese)
- Tibeto Chinese
- Indo Chinese
- Sino Burmese Tibetan
Kirat Group of languages are an outcome of blending between three different geographical circles in
- Sino Tibet Region
- Burmese Belt
- India
Out of these influence of tibeto burman is maximum, Aryans termed the Kirat as a Yellowish Complexion of Tibeto Burmese Population & Hence the Speakers were referred as Kirata
These Languages are spoken from Baltistan (POK) in the West
to NEFA (Assam Arunachal Region) in the East towards Southern Tip of Mizoram
Maximum Populations of Speakers of these Languages, are of mongoloid races, which are considered as an earlier entry than aryans
3 DRAVIDIAN
Languages Are
- Tamil
- Telugu
- Kannada
- Malayalam
- Tulu
- Kota
- Coorgi (Kodaya)
Origin of Dravidan Languages are
- Asia Minor - Turkey
Dictation
These Languages are said to have origin point from Asia Minor (Turkey) i.e the Eastern Mediterrenean Region.
PRE NOTE North Eastern Parts o Indian Peninsula is the East Central India → Chota Nagpur Plateau → Jharkhand + CG + WEB + OD
Along with the Souther Part of the Country Tribal Populations in East Central India i.e North Eastern Parts of Indian Penisula including Gonds, Oraons, Some Segments of Mundas etc are having speakers of Dravidian Group of Languages and Dialects
Along with the Languages and Dialects, Certain Religious Ideas, Notions and Practises amongst the Dravidians are in similarity with West Asia and Middle East
4 INDO ARYANS
1 Also Called Indo Europeans
2 Examples of Languages are (15)
- Vedic Sanskrit - Oldest form of Aryan Language in India
- Punjabi
- Sindhi
- Hindi
- Urdu
- Marathi
- Konkani
- Bengali
- Oriya
- Bhojpuri
- Magadhi
- Maithili
- Assamese
- Marwari
- Gujarati
Most Important Point
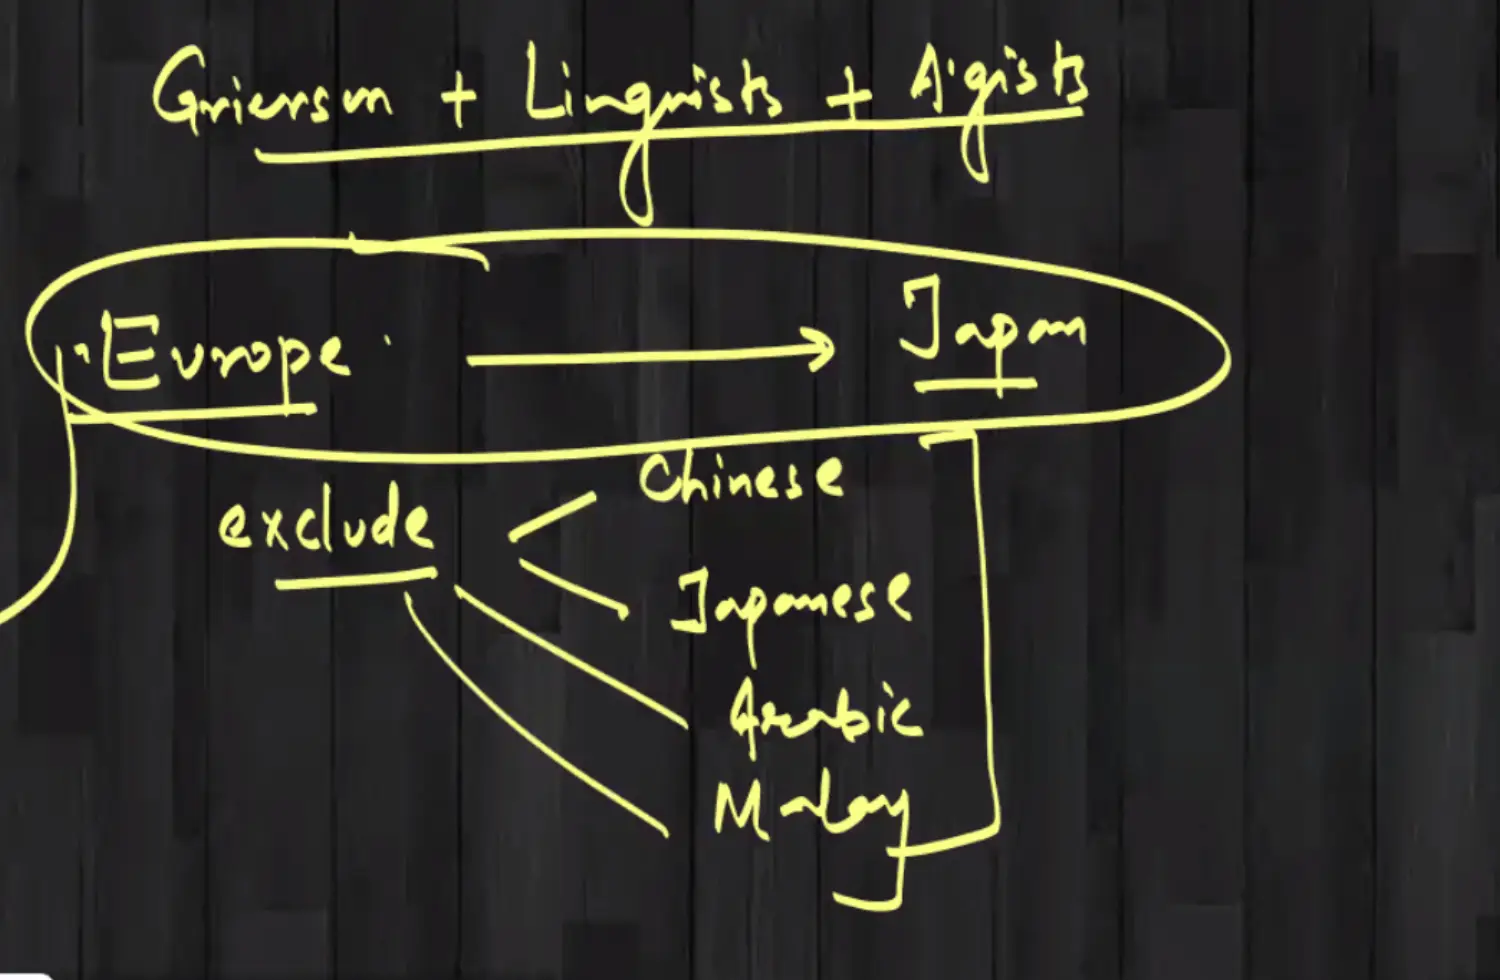
When you move from Europe to Japan Excluding Chinese Japanese Arabic Malay
All are origin of Indo Aryan Languages
Dictaion
Grierson & various other linguists and anthropologist were of the opinion that from Euorpe to Japan. If 4 Languages are Excluded (Chinse, Japanese, Arabic, Malay)
All other Major Languages, are having an origin from Indo European Language Family directly or Indirectly
The Argument was later criticised by many scholars
Conclusion for Dravidian Languages by Grierson
Grierson Maintained that these Languages are considered as intellectual and cultural heritage of India as they formed : a mental, spiritual & cultural links between
India and Europe
Indian and East Asia etc
Conclusion for George Grierson Categories
It was one of the foremost and accepted Linguistic Division for India, even accepted by present day linguists and anthropologists.
Later criticised by many experts for being an oversimplification to have only 4 broad categories as India is havign thousands of dialets in different geographical areas, not matching with each other.